
HPCsoYESTERDAY
-
Posts
1,200 -
Joined
-
Last visited
Content Type
Profiles
Forums
Events
Posts posted by HPCsoYESTERDAY
-
-
-
-
-
I am flexible enough to move my "Core" (inflation protected) positions around, and they need not remain in precious metals, or even in metal commodities.
For instance, I consider owning my own property in HK a "core position." I am now thinking about selling it- after a gain of 50% or so. But I may not do that until I have worked out an alternative place to park a 7-figure inflation-protected investment.
but i am not referring to other positions; of course they have merit (i am fortunate to own a property with enough land for decent-sized vegetable plots)
however, i am referring to having a core position in silver irrespective of other investments - i guess it's down to your overall strategy
i own silver because i think it is in a long term bull that is far from over - simple
-
THAT's WHAT I THOUGHT TOO.
I imagined that Buy&Holders might have an average Silver cost of maybe $8-10 per ounce, or a maximum of $12.
I was AMAZED when I heard that Bob Chapman had an average cost of $18. That means that if Silver falls back to where the Parabolic move started, then he might even have a LOSS on his entire silver position. What sort of Buy & Hold acquisition policy does that show : A buying panic when prices took off last fall - that's what it seemed to me.
I like to buy cheap, and sell dear. I don't chase uptrending markets, because you can always find something cheap, if you dig and research hard enough, which is how I wound up buying things like: the Swiss Franc, GLW.t, and even CRB last year. Not popular trades when Iw as buying in, but they worked well.
so no core position in silver then?
to me a core position is a percentage of a silver metal which is being held against which you may take paper shorts when the opportunity arises from time to time (but never in excess of 20% max of your long position)*.
Also, holding silver miners may lower your allocation of the physical long, but not more than 25% say
a sensible approach in a long-term bull market don't you think?
*this is similar to what S.Thomson advocates
edit - actually 20% is too high, 10% short max would be more sensible imo, if you wish to gamble on the corrections
-
The question raised by Dr Bubb is about buy and hold as a thought about strategy, when it would
seem better, to have a core position and sell a little after strong rises and then be continually adding back in from earnings, where large pull packs from strong rises are normal and expected because there will always be speculative activity supporting the price in strong bull markets.
Ramping buy and hold in a strong pull back is to my way of thinking a bit daft. If it works for some people then fine but there are other ways of approaching this investment and money making strategy.
You also have to wonder to what extent the market is ignorant of federal reserve activities and likely outcomes.
All those base money electronic reserves for example could dissapear enormously quickly as the banks swap into higher interest paying bonds in exchange for uselessly huge amounts of base money that they are currently holding.
All my attempts and other peoples attempts to engage silver and gold investors about this are met
with mostly hate talk and contempt of a highly personal kind. Why is that?
For example if there are huge opportunities in silver based products in the future then there must
be huge opportunities for a sustainable recovery over the next years. That is not talk we hear
much about here where the future is full of collapse and doom.
So what is to be? Feds restoring their balance sheet to normal levels in an inflationary period or a difficult economic
environment for years to come where new products have a hugely difficult time in getting sold
and prices are struggling?
It cannot be just this one eyed view of prices to the moon without large pull backs
was DR. Bubb advocating a core position then?
also i took a short position at $45 & $49 for your info
i seem to recall your opinion a few years ago was that it would fall back to under $10, is that still the case?
edit - short pos. now closed
i think we are within 10% of the pull-back bottom
-
“We are still of the opinion that gold is still in a structural bull market but you had a little bit of a run-up here which is normal, after which one would expect a consolidation to be taking place. What we didn’t anticipate of course is the rapidity with which gold and silver pulled back, particularly silver which was on a parabolic rise prior to the pullback that we witnessed.”
“I certainly think that (silver) was due for a good reversal of what appeared to be an interim speculative bubble. But longer-term you can’t deny that silver has just come out of a 30 year basing process and I think is in a longer-term bull market. But after you have this sort of speculative run-up and decline, you are probably going to have to see a period of weeks to months of a consolidation and reestablishing the next base from which price can pick up at a later date.
...We haven’t had that many bull markets in it (silver). I think it’s intriguing that price went right back up to that major resistance of the old top and has stalled let’s say. It probably needs to come back and stabilize in the 30’s, I’d like to see it hold in the 30’s here.”
but hey, it's just speculators pushing the price up isn't it?
http://www.mining.com/2011/01/19/miners-challenged-to-meet-growing-demand-for-industrial-silver/
The VM Group forecasts the compound annual growth rate of silver, for use in solar power, to rise by 17.5 percent annually over the next decade. This will require about 70 million ounces of silver per year by 2020.The group’s numbers are conservative compared to those of the International Energy Agency, which predicts a need for 85 million ounces of silver a year between 2010 and 2050 for photovoltaics alone.
crazy, crazy, crazy, time to sell silver for sure

edit:
Silver Nanoparticles May One Day Be Key to Devices That Keep Hearts Beating Strong and Steady
Batteries Made of Silver Nanoparticles Could Revolutionize Treatment of Mental Illnesses and Stroke
-
the problem (i find) with comparing to 2008, is that the rises to the peak were completely different
edit - reworded
also - the mar 08 correction was far less on the downside
-
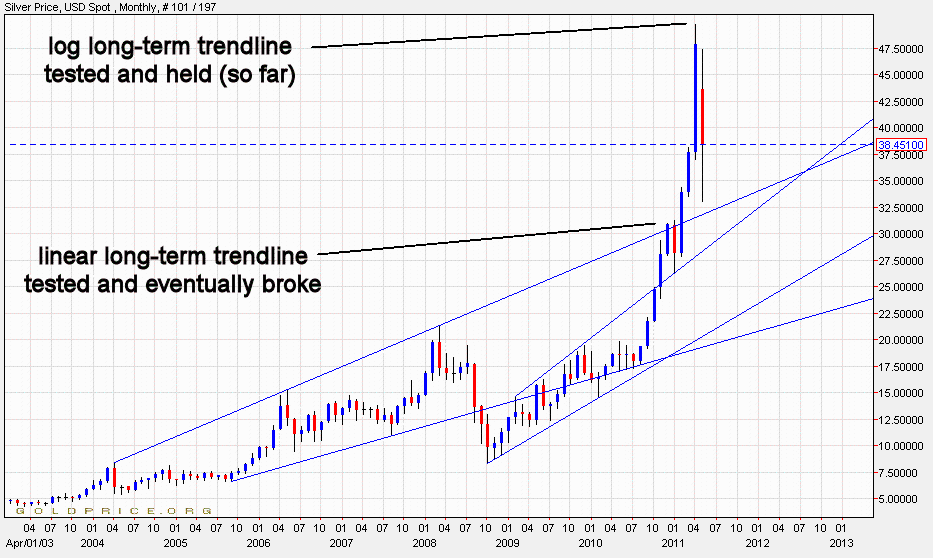
Looks like the long-term linear resistance (broken on upside) will now be tested as support - which needs to happen really, to see how strong it is:
edit-
-
-
-
Hi guys,
I am calling for 500 buck gold this time.
These are the technicals:
http://seekingalpha....erm-update-2011
I am short, and this is going to be my killing trade. Bears, wish me luck.
Regards
ker - imo, you should seek the patterns that exist on the chart rather than impose your pattern onto the chart
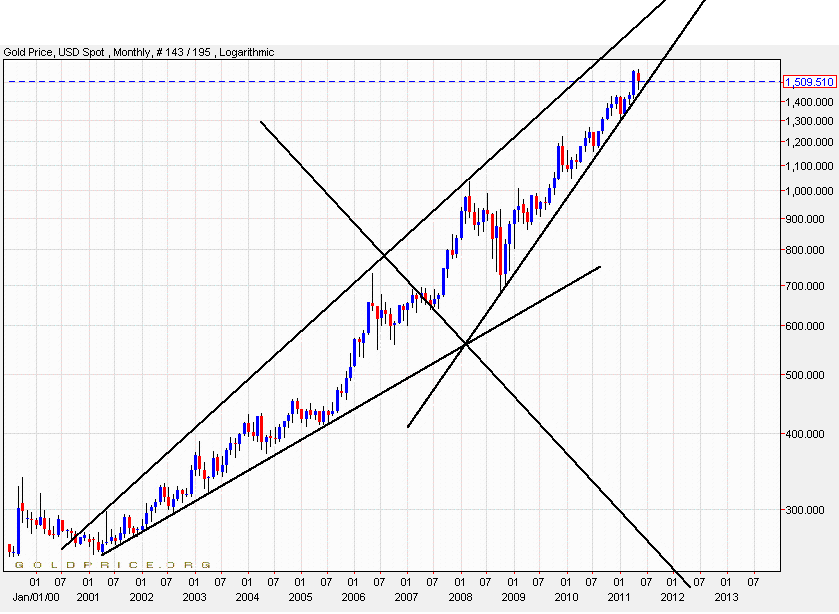
i have found a pattern on the logarithmic gold $ chart; i call it the au log mirror symmetry pattern
of course, it may mean nothing and just be a badly drawn coincidence. However, to me it says that this bull is still on until there is a breakout of that pattern.
At some point in the future it will breakout, but rather than second guess what it means now, i will sit back and wait until the time when i can follow the action rather than take some guess on the future.
one possibility is that, gold will 'do a vertical', or it may just signify that a new volatility is entering the market, or it may be that there is a sell-off
who knows, but what's the point of constantly going against the bull when it's telling you otherwise?
and needless to say the above is all Tech Analysis - fundamentals are not even considered
-
Essentially, the upward correction in the ratio seems to have stopped at the red line for now, and we seem to be bouncing back down again.
http://gold.approximity.com/gold-silver_watch.html

this was perhaps the most amazing call ever to grace these boards *(pix's gold 'lines' coming a close second)
when the sideways move out of the trendline suggested that 35:1 was not going to happen, i must admit i had my doubts (and thought some sort of slower descending channel was emerging).
I guess the problem with TA sometimes is that you have to trust your longer view (chart analysis) over shorter term noise.
Sometimes, just 'saying what you see' in the immediate term can prove misleading as this video demonstrates

(apologies in advance for 'lowering the tone!')
http://www.youtube.com/watch?v=7UA-egInRi0
*edit
-
.../...
Take a look at the action in palladium since the early 09 lows:
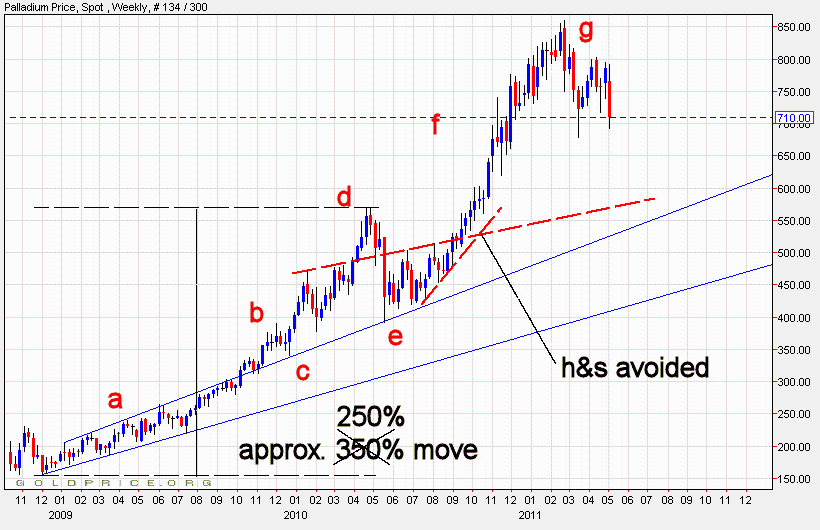
a – confined to an upward channel
b – breakout of channel resistance
c – testing channel exterior as support
d – rising fast and ultimately too quickly
e – violent move down and ultimately re-testing channel exterior as support
f – and the bulls have it
g – hitting long-term trendline resistance (see previous charts in this thread for palladium)
.../...
(Please note this model is now work in progress, so expect revision and updates as appropriate)
Hypothesis: The silver price pattern is replicating that of palladium.
Testing: The testing of this hypothesis will occur in real time as we follow the action in the price of silver.
Analysis: The palladium price 'model' as displayed above has certain key points (a-g) that have either happened with silver (a-d) or that may occur in the future (e-g).
(a-d): It took palladium approx. 18 months to move from the 08 crash bottom to the intermediate high (d). The move was approx. 250%
It took silver approx. 29 months to move from the 08 crash bottom to move to the intermediate high (d). The move was approx. 400%
Intermediate Conclusion: In terms of the model time-line, silver is replicating palladium by a factor of x 1.6. In terms of price, silver is replicating palladium by a factor of (have you guessed it yet) 1.6.
Going forward (current testing): It took palladium 10 months to go move from the intermediate high (d) to the current high (g). Therefore, if the model is viable, silver will hit a new high in 16 months.
How to test this going forward: First and foremost, if silver is replicating the action in palladium, we need to see a h&s pattern avoided in this consolidation period. Furthermore, it took palladium approx. 5 months after the intermediate high to get back to the same level. This would equate to the silver price being approx. $50, 8 months from now.
Possible variation within the model: If the model holds true, it should be noted that volatility in the silver price (esp. on the final move up to 'g') can result in a quicker move to the trendline high 'g' which should be treated as a constant for the sake of this model.
-
-
-
(taken from here)

a – confined to an upward channel
b – breakout of channel resistance
c – testing channel exterior as support
d – rising fast and ultimately too quickly
e – violent move down and ultimately re-testing channel exterior as support
f – and the bulls have it
g – hitting long-term trendline resistance (see previous charts in original thread for palladium)
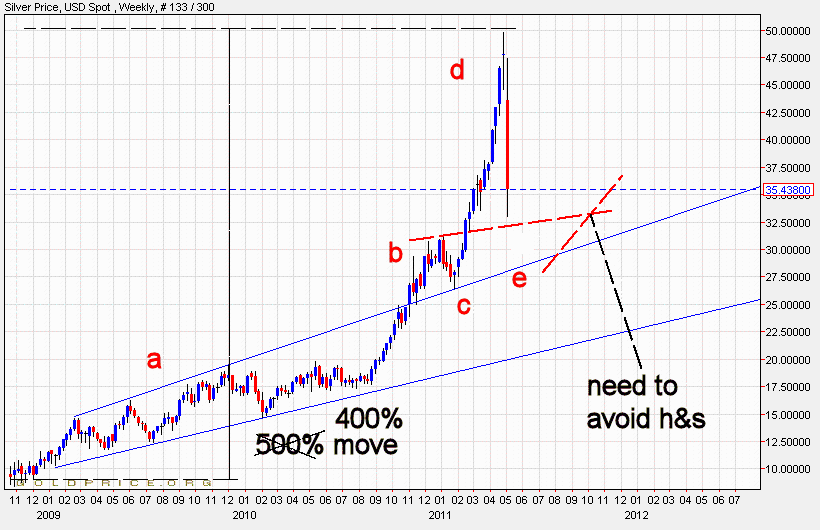
if the pattern is replicating and as ag appears to moving at a slower pace than pd, it makes sense that ag's moves are bigger (amplified)
edit - needed to adjust ag chart
-
Thanks but I wouldn't have noticed it without your cool charts.

Trouble with listing Eagle prices is they are getting quite rare, on Tulving they are spot + $3.49 for a minimum of 500.
They have this offer on currently;
Ship Us Your Monster Box Of Silver Eagles
And We Will Ship You $750 Face Value 90% (Our Choice Dimes Or Quarters)
That's 36.25 Ounces Of Silver For FREE
thanks, it's nice when the charts work. However, i think i should stick to metals because the charts i did on eur/gbp, are looking a bit err., wrong! (though, i am going to stick with the overal direction) lesson learned = stick away from fiat vs. fiat.
re. physical costs, i note what you say re. eagles, so i have included phillies as well (anyone can add to this with prices from other sources)
all price ex. vat and no postage costs added!! (as of 5 mins ago)
Phillie price (gbp) / Eagle price (gbp)
25.09 (cid) / 27.14 (cid)
25.41 (kitco) / 25.80 (kitco)
-
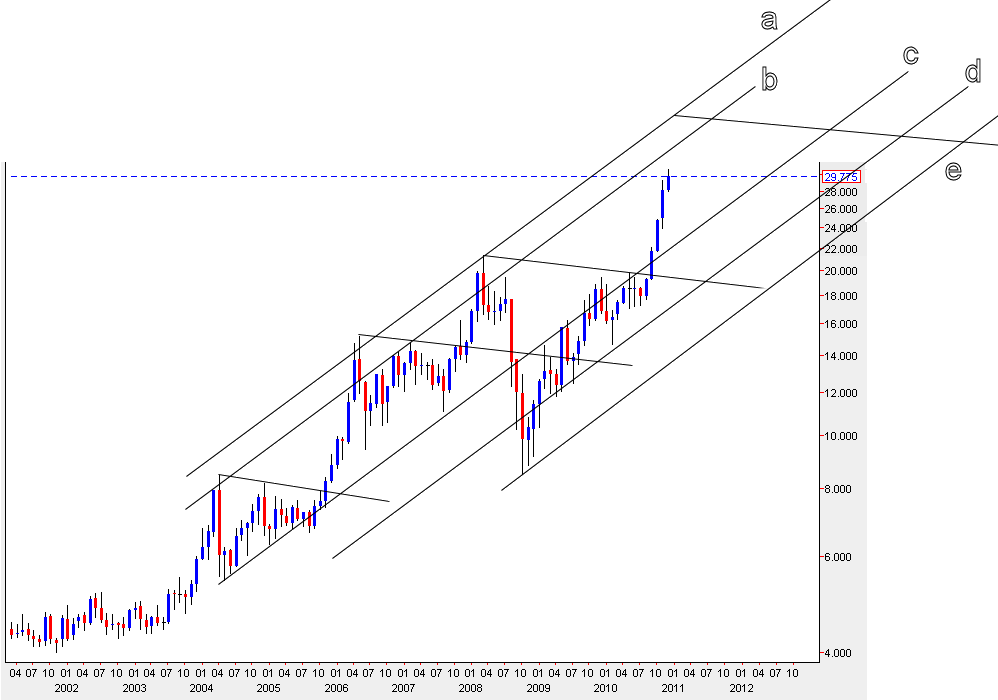
update (with adjustments)
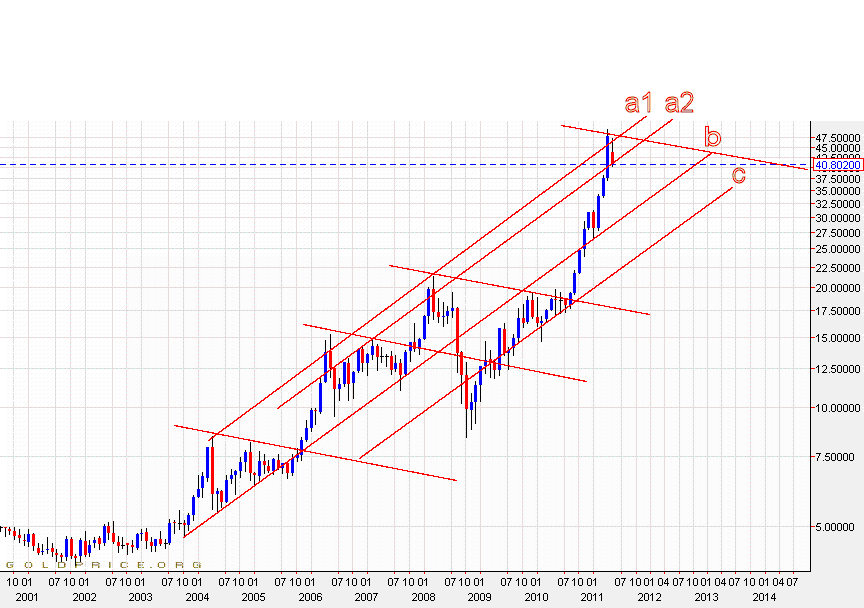
well done pix on recognising the andrews pitchfork and producing an excellent chart worthy of the midas report.
ps - the cheaper the physical price the better!
we should start monitoring the cost of a physical coin like an eagle and keep updating it here.......
-
-
-
ok we all know this would have got pride of place on 321gold at the mo, but interesting reading nevertherless
http://www.321gold.com/editorials/taylor_m/taylor_m_042511.html
-
-

The Best of Youtube - Music
in Gold, FX, Stocks / Diaries & Blogs
Posted
harvi - just noticed them steve hillage vids you posted - great; that's my afternoon's listening sorted
there's something about Steve's and mind blowing guitar sounds
cue Hackett:
http://www.youtube.com/watch?v=nVFFMlVFkz0