


romans holiday
-
Posts
8,549 -
Joined
-
Last visited
Content Type
Profiles
Forums
Events
Posts posted by romans holiday
-
-
An explosive move up [towards 90] on its way soon? But then it's not leveraging the price of silver, more just reflecting it.

-
This chart showing the relation between silver's short term volatility and its strengthening over the long term [the 200 MDA] should lead to the arguably obvious conclusion; precious metals will not act as 'inflation hedges' - with simply explosive moves up in price - but rather they will steadily appreciate in the aggregate being not simply [hyper] inflation hedges but currency hedges. Some have been predicting this quite unmysterious move in price for years.

-
Telling time for silver:

-
Interesting spot for gold. Another wave down, or up up up?

-
I certainly hope so, the recent activity in AGQ has been brutal. It is certainly not for the faint-hearted. The only positive was that I was on vacation for a lot of it, so wasn't paying attention to the blood bath every day.
Right now, my original plan to exit my position in mid-Feb is pretty much in tatters. I was expecting the well-established seasonality in the PM markets to be the main driver. This doesn't seem to be the case. However, this recent activity doesn't affect my belief in the long term fundamentals, and I will begin buying again this week.
Longer term, my big worry is now that I will need these funds later this year as a down-payment for a house. I have a feeling I will miss out on the main action in the next couple of years.
You bought near the bottom of the consolidating phase, so there was always a good chance, given the volatility, that the price would continue to consolidate in the short term. It is in the medium/ long term that confidence is more well-placed towards an increase in the price [assuming silver/ gold is in a bull market]. When silver strengthens again, the short term paper loss will be eaten up very quickly. Stick with it.
Check out the 200 MWA for silver; above 26.

-
Getting absolutely hammered again today, and continuing overnight. All of the gains of the last week have vanished.
This is not a good sign!
A re-test of 1600 would give a good symmetry to the large cup pattern forming since Sept '11..

-
http://gold.approxim...old_charts.html
Chart of the month (January 2013)
They say history does not repeat, but it rhymes sometimes. If, for the purpose of this little column, we assumed that gold price history rhymes from time to time, we would possibly first note, that ever since gold assumed its multi-decade low in 1999 (the infamous Brown Bottom) and then, a year or two later, started its rise in a now more than a decade long bull market, there have been five prominent price spikes: on 2001-05-21 with $288.35, on 2003-02-05 with $385.00, on 2006-05-12 with $725.75, on 2008-03-17 with $1,023.50, and on 2011-09-05 with $1,896.50 (prices are LBM AM Fixings). If we number these price spikes from 1 to 5, we can see that 1 and 2, respectively 3 and 4, are closer to each other. Expressed differently, they seem to come in pairs. Further more, the rise within the pairs (1 to 2 and 3 to 4) was 34% and 41%, while from one pair to the next (2 to 3 and 4 to 5), if we assume that the most recent fifth spike belongs to a pair as well, it was 89% and 85%. If we take the middle of these respective moves, and also extrapolate the times between them into the future, we could try and guess what a sixth (second spike in a third pair) and a seventh price spike (first spike in a fourth pair) could look like (see also chart below). Our guess would be 2013-06-24 with $2,603.37 (spike 6) and 2015-01-29 with $4,865.73 (spike 7). So, should you be surprised if you would see a $1,000 move in gold in the first half of 2013? We think you shouldn't.
Best wishes for 2013 from the Approximity Gold Team!

So something like a 20% appreciation of the 'base-line' averaged year on year?


-
$Silver not too far off its 200 week MA. Doubt it would get quite that low though.

-
.......
And that's the problem with all these indicators, whether they be bollinger bands, rsi, macd or whatever new flavour some bod might have concocted from historical plot studies: they simply distract, obfuscate and add an air of specious mathematical legitimacy to what is essentially an emotive, intuitive phenomenon : natural appearance.
Charts either talk to you or they don't. Bands and lines and oscillators won't help, because charts will always break the mathematical rules we try to impose on them. The bands and other constructs may appear to offer insight, but the nature of trading, even with the best money management techniques, will ensure they take as much as they give, whether we stick to them rigidly or take them only as guides. At best, they are a neat way of commenting on positions w/o being too wide of the mark. At worst they can lose you everything.
....
Yep, pretty much agree. The 'technicals' can be just as much a disadvantage as an advantage insofar as they detract or distract from the simpicity of a long term log chart.
So linearising a chart by looking at its log plot might turn a golden-mean looking chart into a linear one,...Not sure what you mean by this.
-
Here you go, right on cue, I've added a couple of lines to give an idea of possible trendlines;
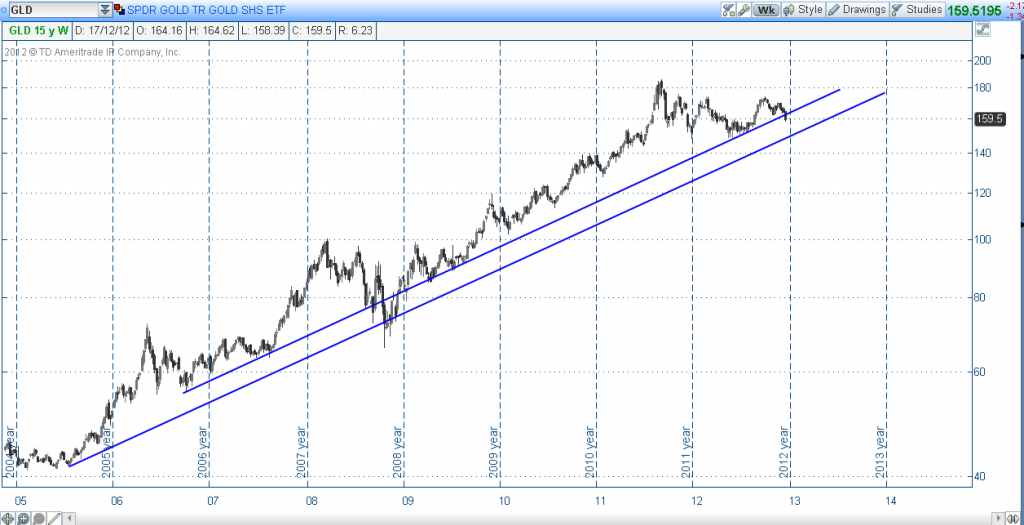
According to this it could even go down to as low as $1400 and still be in an uptrend, any lower though and that view would be thrown into severe doubt. Strangely I've not been concerned about this downmove and that is worrying in itself, sentiment according to sentimentrader is at 50%, really not very low at all....uh oh.
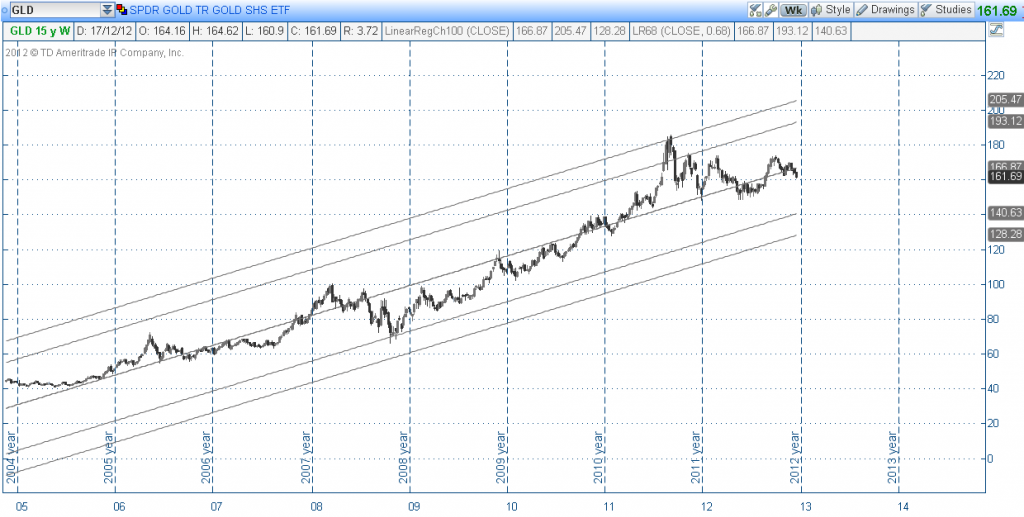
Thanks PD. That has to be the chart by which to keep your bearings in the seasonal, or not so seasonal, squalls. I would interpret it slightly different as far as 'trend lines' go. As opposed to the straight line, where the price is supposed to 'bounce', I prefer to see the [occasionally punctuated] curvature of a cup on these kind of corrections. For me, the low point in '08 is the equivalent of the low we saw this mid year [which was around 1550 if I remember correctly]. The cup pattern this time round was not as deep. I think this dip here will be relatively brief.. perhaps down to 1600.... and then to new highs. If the chart [and that reading] is anything to go by, now is the time to buy.
I agree with Sledgehead's point that often you have to let a chart speak for itself... and this long term log is speaking volumes. The trick for the trader, not to mention the investor, is to be disciplined and to bracket out the daily emotion and headline news. Helps also to be well hedged.
-
Over in Japan, a small but growing number of pension funds are buying gold as a hedge against zero-bond yields and the long-term decline in equities, says a report in today's Wall Street Journal.
"By diversifying currencies, we aim to reduce risks associated with them," the WSJ quotes Yoshi Kiguchi, chief investment officer at Okayama Metal & Machinery Pension Fund.
It began investing in gold this March on behalf of the 260 small and mid-sized company pension schemes it runs.
-
GLD
This is over the last few years, doesn't look quite so bad, I would get concerned if it went below $1500...
Nice chart.... bet it looks even better on the log though.
-
I am trying to find a chart which shows Macd over a longish time frame. Where did you get this one from, please?
These charts from stockcharts.com. But if you want longer time frames, you need to subscribe.
The weekly and daily charts suit me fine for trading. I try to let the MAs do the talking. An excellent time to buy gold wouldn't you agree?

-
Gold down hard through 1700 even after the big meeting. Will be interesting to see whether support at 1670 holds.

Perhaps a brief dip below the 50 week MA. $Gold looks to be tracing out a large cup pattern. This dip could be near symmetrical to the earlier dip at the end of last year [though perhaps not so precipitous as the price looks to be stabilizing/ consolidating near the MWA] before heading back to the old highs.
-
Yes, odd behaviour overnight, that... Things that make you go hmmm.......

Or just some profit taking by the hedgies triggering some stop losses.
-
Gold down hard through 1700 even after the big meeting. Will be interesting to see whether support at 1670 holds.
-
That $1675/1680 low is going to be retested soon IMHO - hope it holds.
I sold off the last of my GDX recently, thank goodness
On the backend of the long consolidation since the spike [a large cup pattern], the 50 week MA looks good support.

-
-

Looking at both MAs, the consolidation in silver seems to be near completed. Am guessing the 50 week MA will provide support in the interim beofre silver strengthens towards 50 next year.
-
Under $1000 will be tested again in the next few years when deflation kicks in before currency distruction, what are people's plans to cope with this; sell when they feel deflation has started (now?) and buy in again at the bottom or just hang on in there..
Reckon the long term trend should hold alright... more of the same. Reason being, gold is an alternative currency. i see the term 'counter currency' is being bantered about lately.
-
Long term trend:

-
Down-trend resumed?

-
http://www.marketwatch.com/story/gold-futures-retreat-after-sharp-gains-2012-11-30
We raise an eyebrow at talk of an early settlement of the issue well before year’s end,” Phillips said in a note. “We expect the political game to be played to the full. All markets including gold and silver will be made volatile as each chapter is read to the public and digested for them.”
View for next week
The gold market will continue to be driven by fiscal-cliff talks next week, said Jeffrey Wright, managing director at Global Hunter Securities. Read about the impact of a fiscal cliff deal on gold.
“While the Republicans appear to be flexible on tax increases, the administration has shown no inclination to put any real spending cuts on the table,” he said.
“I do not think the market or public believes the promise of future spending cuts will ever materialize. The end result will probably be continued stagnant growth in a higher tax environment, and the Fed will be forced to continue easy monetary policies indefinitely,” said Wright. That’s “good for gold.”
-
Now 19.5% :
Will be interesting to see if silver can push through 35 here or whether there is further consolidation in the recent trading range.

GOLD
in Gold, FX, Stocks / Diaries & Blogs
Posted
A re-testing of the 1600 level and then off to the races? This would complete the large consolidating cup [bowl] seen since the spike in 2011.