


drbubb
-
Posts
112,497 -
Joined
-
Last visited
Content Type
Profiles
Forums
Events
Posts posted by drbubb
-
-

+ The Return on Builder stocks is 25%. This is based on a very simple metric, PE Ratios, This the average of a portfolio of Seven selected Property stocks that I will be discussing in a breakout group. IMHO, this area of investment has been mostly neglected in our Saturday meetings, and I want to address that neglect, by having a small group with a stronger focus on stocks. we will probably meet in a different location
+ It is interesting to see now the that currently reported PER ratio of that Group of 7 stocks is: 3.96x which means an Earnings Yield of 25.3%. The average Dividend Yield of the same group is 4.72%. That is below the average REIT yield of about 8%. I now think there is potential for strong rises in dividends, since Earnings are rising post-Covid and the average payout is only 19% of Earnnings. This group also trades at only 26% of Book value. And book value is growing thanks to the low payout ratio.
+ Here are my estimates of expected returns over the next 2-3 years, based on some quant measures:
PRICE TARGETS, based on Peak Comparisons
============
+ % Book : 25.6% > 60-66%, = +134 -158%
+ PE Ratio: 3.96x > 5.8-9.1x. = +46 - 130% (+earnings rise)
+ Div.Yield: 4.72%> 3.6-3.2%= +31 - 48% (+divs. rise )+ My opinion overall is AVERAGE of these stocks could rise 50-100% over the next 2-3 years, as the US TBond market stabilises and undervalued builder shares return to more normal Discounts to Book Value, PE Ratios, and historical dividend yields. RISES will be accelerated if they raise dividends faster than Earnings rise
-
UPDATE: Low PERs suggest room for big DIV. rises in these Builder stocks
PRICE TARGETS, based on Peak Comparisons
============
+ % Book : 25.6% > 60-66%, = +134 -158%
+ PE Ratio: 3.96x > 5.8-9.1x. = + 46 - 130% (+earnings rise)
+ Div.Yield: 4.72%> 3.6-3.2%= + 31 - 48% (+divs. rise )MEG-etc.:2.02-SHNG:3.61:-P1.59, 56.0% CPG 0.34=16.8% MEG

ROCK-etc: 1.50,-VLL: 1.60: (P0.10), 93.8% FLI 0.65=40.6% VLL

Stock : Last: Bk.V.: %BV: PER: E.Yld : D.Yld : Div%: LastD: ex-Div
MEG. : 2.01 : 6.64: 30.3% 4.06: 24.6% 3.28% 13.3%: .0660: 10.26
SHNG: 3.58: 8.43: 42.5% 3.77: 26.5% 8.08% 30.5%: .1344 : 09.07
CPG. : .315 : 1.85: 17.0%: 4.75: 21.1% 3.84%: 18.2%: .0061: 09.28
ROCK: 1.37 : 4.16: 32.9% 3.28: 30.5% 5.49%: 18.0%: .0752: 08.17
VLL. : 1.65 : 9.07: 18.2%: 2.70: 37.0% 3.76%: 10.2%: .0620: 10.16
FLI. : .610 : 3.69: 12.1%: 4.63: 20.8% 5.90%: 28.3%. .0360: 05.09
ALCO: .445 : 1.90 : 26.1%: 4.56: 21.6% 2.70%: 12.5%. .0120: 07.12
== Average of 7 : 25.6% 3.96=25.3% 4.72%: 18.7% =====
== Old.Ave. of 7 : 27.0% 4.20=23.8% 4.19%: 17.6% =====
Compare Big 3:
ALI. : 28.65 17.30 166.% 19.44 5.14% 0.99% 19.3%. ?
SMPH 30.70 12.58 242% 25.00 4.00% 0.77% 19.3%. ?
DMCI: 10.26 7.79: 132.% 5.11 : 19.6% 14.0%. 71.4%. ?
== Average of 3 : 180.% 16.5 =9.58% 5.25%: 54.8% =====12/’19 Peak comparison
MEG. : 4.01 : 5.54: 72.4% 7.44: 13.4% 1.75%: 13.0%: .0700: 2019
SHNG: 3.20: 7.35: 43.5% 4.99: 20.0% 5.63% 28.1%: 0.180: 2019
ROCK: 2.04: 3.46: 59.0% 4.22: 23.7% 4.07%: 17.2%: 0.083: 2019
CPG. : 0.55 : 1.51 : 36.4% 4.98: 20.1% 2.16%: 10.8%: .0119 : 2019
VLL. : 7.73 : 7.69 : 101.% 8.71: 11.5%. 3.36%: 29.2%: 0.26 : 2019
FLI. : 1.50 : 2.97 : 50.5% 5.79: 17.3% 4.13%: 23.8%: .0619 2019
ALCO: 0.81 : 1.35 : 60.0% 4.26: 3.77% 1.23%: 0.74%: .0100 2019
== Average of 7 : 60.4% 5.77=17.3% 3.19% 18,3% ====< 2019
== Average of 7 : 25.6% 3.96=25.3% 4.72% 18.7% ====< 10.2312/’18 Peak comparison
MEG. : 4.75 : 5.08: 93.5% 10.15 9.85% 1.26%: 12.8%: .0600: 2018
SHNG: 3.12: 6.88: 45.3% 4.93: 20.3% 6.41%: 31.7%: 0.200: 2018
ROCK: 2.01: 3.03: 66.3% 4.78: 20.9% 3.48%: 16.7%: 0.070: 2018
CPG. : 0.44: 1.41 : 31.2% 5.08: 19.7% 4.55%: 23.5%: .0200 2018
VLL. : 5.41: 7.02 : 77.1% 6.76: 11.5%. 4.25%: 28.8%: 0.230 2018
FLI. : 1.41 : 2.76 : 51.1 % 5.81: 17.2%. 4.26%: 24.7%: .0600 2018
ALCO: 0.96 : 0.99: 97.0%. 26.5: 3.77%. 1.04% : 27.6%: .0100 2018
== Average of 7: 65.9% 9.14=10.9% 3.61%: 23.7% ====< 2018
== Average of 7 : 25.6% 3.96=25.3% 4.72% 18.7% ====< 10.23 -
UPDATE: Low PERs suggest room for big DIV. rises in all these stocks
PRICE TARGETS, based on Peak Comparisons
============
+ % Book : 25.6% > 60-66%, = +134 -158%
+ PE Ratio: 3.96x > 5.8-9.1x. = + 46 - 130% (+earnings rise)
+ Div.Yield: 4.72%> 3.6-3.2%= + 31 - 48% (+divs. rise )MEG-etc.:2.02-SHNG:3.61:-P1.59, 56.0% CPG 0.34=16.8% MEG
ROCK-etc: 1.50,-VLL: 1.60: (P0.10), 93.8% FLI 0.65=40.6% VLL
Stock : Last: Bk.V.: %BV: PER: E.Yld : D.Yld : Div%: LastD: ex-Div
MEG. : 2.01 : 6.64: 30.3% 4.06: 24.6% 3.28% 13.3%: .0660: 10.26
SHNG: 3.58: 8.43: 42.5% 3.77: 26.5% 8.08% 30.5%: .1344 : 09.07
CPG. : .315 : 1.85: 17.0%: 4.75: 21.1% 3.84%: 18.2%: .0061: 09.28
ROCK: 1.37 : 4.16: 32.9% 3.28: 30.5% 5.49%: 18.0%: .0752: 08.17
VLL. : 1.65 : 9.07: 18.2%: 2.70: 37.0% 3.76%: 10.2%: .0620: 10.16
FLI. : .610 : 3.69: 12.1%: 4.63: 20.8% 5.90%: 28.3%. .0360: 05.09
ALCO: .445 : 1.90 : 26.1%: 4.56: 21.6% 2.70%: 12.5%. .0120: 07.12
== Average of 7 : 25.6% 3.96=25.3% 4.72%: 18.7% =====
== Old.Ave. of 7 : 27.0% 4.20=23.8% 4.19%: 17.6% =====12/’19 Peak comparison
MEG. : 4.01 : 5.54: 72.4% 7.44: 13.4% 1.75%: 13.0%: .0700: 2019
SHNG: 3.20: 7.35: 43.5% 4.99: 20.0% 5.63% 28.1%: 0.180: 2019
ROCK: 2.04: 3.46: 59.0% 4.22: 23.7% 4.07%: 17.2%: 0.083: 2019
CPG. : 0.55 : 1.51 : 36.4% 4.98: 20.1% 2.16%: 10.8%: .0119 : 2019
VLL. : 7.73 : 7.69 : 101.% 8.71: 11.5%. 3.36%: 29.2%: 0.26 : 2019
FLI. : 1.50 : 2.97 : 50.5% 5.79: 17.3% 4.13%: 23.8%: .0619 2019
ALCO: 0.81 : 1.35 : 60.0% 4.26: 3.77% 1.23%: 0.74%: .0100 2019
== Average of 7 : 60.4% 5.77=17.3% 3.19% 18,3% ====< 2019
== Average of 7 : 25.6% 3.96=25.3% 4.72% 18.7% ====< 10.2312/’18 Peak comparison
MEG. : 4.75 : 5.08: 93.5% 10.15 9.85% 1.26%: 12.8%: .0600: 2018
SHNG: 3.12: 6.88: 45.3% 4.93: 20.3% 6.41%: 31.7%: 0.200: 2018
ROCK: 2.01: 3.03: 66.3% 4.78: 20.9% 3.48%: 16.7%: 0.070: 2018
CPG. : 0.44: 1.41 : 31.2% 5.08: 19.7% 4.55%: 23.5%: .0200 2018
VLL. : 5.41: 7.02 : 77.1% 6.76: 11.5%. 4.25%: 28.8%: 0.230 2018
FLI. : 1.41 : 2.76 : 51.1 % 5.81: 17.2%. 4.26%: 24.7%: .0600 2018
ALCO: 0.96 : 0.99: 97.0%. 26.5: 3.77%. 1.04% : 27.6%: .0100 2018
== Average of 7: 65.9% 9.14=10.9% 3.61%: 23.7% ====< 2018
== Average of 7 : 25.6% 3.96=25.3% 4.72% 18.7% ====< 10.23 -
TECHNIQUE SUMMARY
TRADE SELECTION: A very brief SUMMARY of my technique:
I aim to utilize ALL of the following in my trade selections:
+ I prefer LOW PER stocks, like <5x
+ I prefer HIGH DIV Yield stocks
+ I prefer to BUY BELOW BOOK Value
+ I want to see Leverage falling, as Total Borrowing declines and Shareholder equity is rising
+ I want a chart which shows signs of a bottoming process being underway, rather than a “falling knife”RELATIVE VALUE Focus:
I focus on raising my account's value RELATIVE to the Index. (Aim: >1% / mo. outperformance)I don't necessarily stay invested ALL of the time, but I don't panic if NAV is falling, so long as NAV is rising vs. Index
I look for Pairs Trading type switches, where I will sell the "overvalued" side & replace with the "cheat" side.
( MORE TO COME Later... )
-
MODEL Portfolio, 10.20.23
BTC. 1.66m .0667: 110,722 100.0k 1.50m
MEG. 2.01. 99,502: 200,000 200.0k 2.01
APX. 2.58. 86,957: 224,349 200.0k 2.30
RCR. 4.76. 42,373: 201,695 200.0k 4.72
==== ====: 736,766 700.0k
Cash ==== ==== 300.0K 300.0k ===:
Profits. +10.889: 10.9K. <gain
Model ==== ==== 1047.7K 1000.k +4.77%WATCH Portfolio, 10.20.23
FILRT 2.99 33,557: 100,335 100.0k 2.98
LTG 8.83 11,123: 98,216 100.0k 8.99
MAXS 4.30 25,062: 107,767 100.0k 3.99
RCI .495 196.08k 97,060 100.0k 0.51
ROCK 1.37 71,429: 97,858 100.0k 1.40
VLL. 1.65 59,880: 98,802 100.0k 1.67
Mreit 12.20 8,210: 100,162 100.0k 12.18
====. ====. 700.2K 700.0k
Cash* ==== ==== 300.0K 300.0k ===:
Watch ==== ==== 1000.2K 1000.k +0.02%Both: Model ==== 1047.7K 1000.k +4.77%
Combined, M+W: 2047.9k 2000.k +2.40%
Vs. PSEI. 6,143. 6,321 : -2.82%
Outperformance : +5.22%
Profits:
+sold half BTC at Php 166.5m, +10,889 (M)MY GOAL is to beat the Index by 1% per month.
-
Why Builder stocks, Why Now?
Stock Prices were dragged down by falling bonds
EXPECTED RETURNS in Property
Investment: “Expected” : Notes
Buy-Build-Sell: 30%+: what Risks?
Builder Stocks: 25%+: Per PER=4.0*
Stock Trades : 13%+: +PSEI gains
Land (lots?). : 10% ?: Long term?
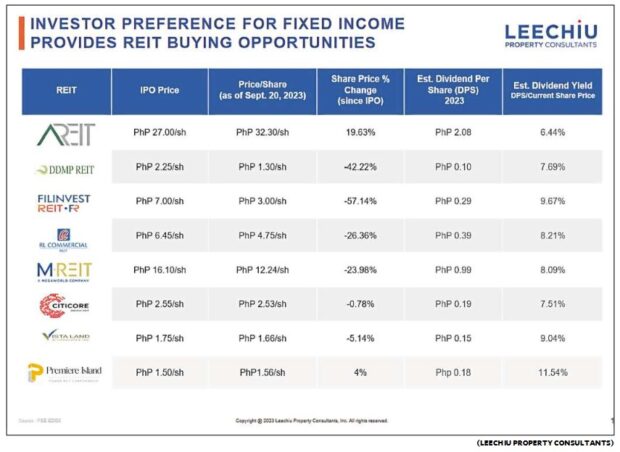
REITS, phil. : 8% +: +Cap.Gains
2nd-H.Bargain: 6% +: Mgmt. Issues
New Condos. : 3% +: +Cap.Gains( This was a jumping-off point for the discussion
That I happened Sat. morning, Oct. 20th.)Near Market peak is 2019, the PER was 6-9x
% Book Value was 60-66%, vs. 26% now.
UPDATE: Low PERs suggest room for Rises in 7 Builder stocks
PRICE TARGETS, based on Peak Comparisons
============
+ % Book : 25.6% > 60-66%, = +134 -158%
+ PE Ratio: 3.96x > 5.8-9.1x. = + 46 - 130% (+earnings rise)
+ Div.Yield: 4.72%> 3.6-3.2%= + 31 - 48% (+divs. rise ) -
I HAVE SLOWLY PERFECTED Some trading techniques, which are helping me to outperform the market. And I am considering to offer these techniques For FREE in a Seminar, that I might run from time to time, over a coffee.
(Please CLICK LIKE on this post if you might be interested.)
LIKES: +1/4-sat, +1/7-reit, +3/19-option
+ Richard; Ian M.; Jonathan R, Reinhart S., Kenneth Sy
====
MY GOAL is to GROW the value of my portfolio faster than the PSEI, by 1% a month. That means after 12 months, I want to outperform by 12%. This is not easy, but it is a fine, sensible, and realizable goal. And more logical than a 15% a year goal, which may be easy in some years; Tough in others.
In the Real world, my actual Phl-Portfolio, just hit a new high vs. PSEI. So I am happy on a day, when my portfolio is down -0.13%, and PSEI is down -0.91%. That makes me smile, and keeps my focus in the right place: Relative Valuation! Given time, the PSEI will grow, in line with Inflation, perhaps.
-
Bang, Bang! They shot MEG down.
Big Volumes sellers came in (again) at EOD to know MEG down to 2.04

Wed ( 2.04 - 0.03, vol. 39.2 Mn.),
Wed ( 2.04 - 0.04, vol. 57.3 Mn.),"Bang! Bang! They shot my Baby down!" (cleaning out the stale bulls?)
-
I INVITE you to entertain the possibility...
That an important BOTTOM for the PHL Developer stocks may now be in place.
If so, that may be because TLT / Bonds are bottoming. And REITS will do well too.
VLL-etc (1.68, 5.65%): / ALI (29.75), MEG (2.04, 6.86%), FLI (0.63, 2.12%): 7/22: YTD: 7/23:
If i am right, the "lower quality" developers with much lower PER's may outperform AyalaLand from here.
We are already seeing that with SHNG (3.58, 12.03%), as it progressively raises its dividend
===
I will talk about this at the next SAT Meetup.
And also tell you about an informal seminar that I may be hosting in the future
-
-
ROCK EXPANDING
LPZ - Rock : xx C04633: Rockwell Land press release - 1
"ROCKWELL LAND EXPANDS FOOTPRINT IN 3 CITIES WITH 200 HECTARES OF DEVELOPMENT"
Rockwell Land Corporation (PSE: ROCK), at its Annual Stockholders' Meeting held on June 14, 2023, announced its expansion plans of almost 200 hectares of development in Cebu, Bulacan and Batangas. The company is set to launch IPI Center by Rockwell, its third project in Cebu this year. It is a 2.85-hectare mixed use community featuring Rockwell Workspaces and a unique retail concept.
"We are looking forward to our newest Cebu project with the Wong and Castillo families of International Pharmaceuticals Inc., which is located in the heart of the city. We'll first offer residential units through Lincoln, inspired by the well-received Proscenium tower in Makati, and will soon be complemented by a retail area that we envision will excite the market," says Rockwell Land Chairman and CEO, Nestor Padilla.
Making its mark in a new thriving city, Rockwell will develop a new horizontal neighborhood in San Jose, Bulacan. The 100-hectare project in Bulacan will be designed to build a hillside escape and wellness retreat for its future residents. The company will also develop a future project in Lian, Batangas poised to be its first premium horizontal beach community in the area. "We are excited about our new vast 85-hectare beach property. It has 700 meters of coastline and clear waters, spread across 2 natural coves," adds Padilla. In 2024, Rockwell expects to launch its first phase of residential lots.
Rockwell reported an increase in its Net Income After Tax (NIAT) to Parent of 40% in 2022 compared to previous year, and expects to reach pre-pandemic NIAT levels by year end.
-
CATCHING up on NEWS, as stock prices stays weak
SHLPH : Last: 13.50. (Range: 13.40 to 18.70 ).. BV P 19.29 at 9.30.23. 9mo EPS: 1.27 vs 2.73
 SHLPH - Pilipinas Shell: Shell Pilipinas press release ( Aug. 15th)
"Shell Pilipinas Shows Strong H1 Performance with 1.4B Core Earnings" /xxB = xx per sh
Shell Pilipinas Corporation (SPC) recovers from its net loss in Q1 and delivers a net income of P123 million for the first half of 2023, amid challenging conditions brought about by volatility in oil prices and tripling of interest rates. SPC's core earnings for the first half of 2023 stand at P1.4 billion as its marketing business rebounds. Total marketing volume increased by 9% while premium products increased across key sectors. Non-fuel retail (NFR) also posted a double-digit growth of 14% from last year and is 33% higher than the pre-pandemic period.
However, this remarkable marketing delivery was tempered by the aforesaid factors that affected the industry. "We have built momentum and we will finish strong in 2023 with exceptional customer experience and continued innovation in serving our growing customer base with world-class Shell products and services," SPC President and Chief Executive Officer Lorelie Quiambao-Osial said. ...
-
WATCHING MEG vs. Key Moving Aves. 10d: 10.16 cls @2.08

MEG at 2.06. Maybe this will be the week that MEG closes above the key 252d./ 1 year MA. To me, it is more important than the more widely-followed 200d MA
MEG Div announced: now 0.066,
====
2023: 0.06599567 ex.10.23. pay 11.14; 0.066/ 2.07= 3.19%
2022 : 0.06146228 ex.10.23. pay 11.14
Chg : + 7.37%,
( I expected more, since 1h.23 EPS were up 31%
“Net income soared by 31% to P8.8-billion”PER of 4.186 is an Earnings Yield of 23.9% at 2.07, and MEG's new Div. Yield is just 3.19%, that's only 13% of Earnings
MEG-etc: 12.24 / 2.07 = r-5.91 : Flip:
: Flip:

-
Quiet DISCOUNTS are a new reality.
If they move this smallish # of units quickly, the discounts will disappear. If they do not, then discount may spread since there is still a lot of SUPPLY in the pipeline, and buyers may be finding it tough to finance (and swallow) the big Lump Sum payments they are left with prior to delivery. Interesting times we are in, since most of the Developers are sticking with FOMA, price-raising strategy, while their reported profits swell... but buyers are getting cold feet.
TALE OF TWO DEVELOPERS
Coping with a glut of new property turnovers thru quiet discounts
I reckon some properties are selling very well. But not All. And those which are slow-moving, or hard to rent, there may be some new strategies that the developers are using to reduce potential excess inventories before year end. Recently, I have heard:+ Developer X supposedly was sold out... on one of their projects in the Makati area as of a few months ago, but now that project is coming up for turnover in Q1 next year. So they can now offer you a 26 sq studio for P 6.7M with 10% down and 90% before turnover - that’s P 258k per sq. But if you ask, “Is there a discount for cash payment,” you may find as I did that the price gets much cheaper, a 15% discount, bringing the price down to “just” P 5.7 Million. That is just P 219k per sq. I reckon that you would cost P200k to furnish, and could be rented at 20-22,000. At 22k x12= P 264k / 5.9M= that is a 4.47 % gross yield. Unfortunately, this is below my own investing target.
+ Developer Y is offered a Zero Down Payment scheme.
20% is paid in the first three years, through equal monthly payments over 36 months. The lump sum amount of 80% is over 8Million, or about 280k per sq. (message me, if you want more precise details.). What makes this interesting is that you can get the key* after 9-10 months. If you rent it out, the rent might cover about half of the monthly payment of under 60,000 a month. So the cost is subsidised for most of the first three years. The question to ask is, will the buyer have an easy time coping with the remaining payment. Essentially, the 10% that used to be paid upfront as a downpayment, has been moved to the 36th month.
These deals are not really cheap, but they do show that developers are aiming to keep sales up, in some slow projects, by offering significant discounts. This is a new development.
===
*Note: still checking the actual terms. Since there may be some other payments required before move-in
**IMPORTANT CORRECTION:**. On Developer Y's ZDP scheme. There is No Early turnover of the KEY. The LUMP sum must be paid before the key is obtained. So no subsidized help from RENTING out or Buyer 's own-use. (This was just confirmed to me.)
-
This very same success, however, has also become one of its main challenges. The high cost of entry to real estate assets—especially in relation to our GDP per capita—has now made it difficult for the average Filipino to buy real estate.
Enter: REITs
A Real Estate Investment Trust, commonly known as REIT, is a publicly-listed and traded corporation that owns and operates income-generating real estate. These include office buildings, residential complexes, malls, hotels, hospitals, and infrastructure projects.
When you buy into a REIT, you are essentially buying shares of the real estate assets in the REIT’s portfolio, which usually consists of high-quality assets in core markets. This offers investors a compelling opportunity to participate without the high engagement and capital requirements typically associated with property ownership.
Date : RCR , % AR : MReit, % AR : AReit : / TLT = %TLT
09.07: 5.07, 15.8% : 13.56, 41.6% : /32.60 /93.75= 34.8%
10.13 : 4.89, 15.0%: 12.22, 37.4% : /32.70 /87.61= 37.3%
-
( I will show you why, I am losing interest in our property discussions. Probably some will not believe it, will not understand it. Or may not care. But to be honest, I signaled these trades as I was doing them, and posted them on a New chat. It is REAL, folks.)
MODEL Portfolio, 10.13.23
BTC. 1.52m 0.1333: 202,616 200.0k 1.50m
MEG. 2.06. 99,502: 204,974 200.0k 2.01
APX. 2.55. 86,957: 221,740 200.0k 2.30
RCR. 4.89. 42,373: 207,204 200.0k 4.72
==== ====: 836,534 800.0k
Cash ==== ==== 200.0K 200.0k ===:
Model ==== ==== 1036.5K 1000.k +3.65%WATCH Portfolio, 10.13.23
FILRT 3.00 33,557: 100,671 100.0k 2.98
LTG 9.00 11,123: 100,107 100.0k 8.99
MAXS 4.30 25,062: 107,767 100.0k 3.99
RCI 0.53 196.08k 103,922 100.0k 0.51
ROCK 1.42 71,429: 101,429 100.0k 1.40
VLL. 1.73 59,880: 103,592 100.0k 1.67
====. ====. 617.5K. 600.0k
Cash* ==== ==== 400.0K 400.0k ===:
Watch ==== ==== 1017.5K 1000.k +1.75%
Model ==== ==== 1036.5K 1000.k +3.65%Combined, M+W: 2054.0k 2000.k +2.70%
Vs. PSEI. 6,266. 6,321 : -0.87%
Outperformance. : +3.57%MY GOAL is to beat the Index by 1% per month.
*Note;
VLL: 0.062 ex-div 10.13.23= 3,713 = 3,341MY GOAL is to beat the Index by 1% per month over a period of many months.
After just two weeks, these two portfolios are CRUSHING the target ! Beating the index by 3.5%!HAHA. Who needs Bricks & Mortar, if you can do it with stocks?
(Please do NOT expect this sort of outperformance to continue.
The LAW of AVERAGES will catch up... eventually.)
-
MAXS, Buying back shares, up 9.57%
MAXS: 4.35 +0.38, +9.57%

===
MAXS - Max's Group, Inc.C07433: Max's Group share buy-back transactionsType of Securities: Common Details of Share Buy-Back Transaction(s): Date of Transaction: Sep 1, 2023
Number of Shares Purchased: 877,600 Price Per Share: 4.68 (P 4.1 M.)
Effects on Number of Shares: Outstanding Shares BEFORE: 1,037,292,224 AFTER: 1,036,414,624 (- xx%)
Treasury Shares BEFORE: 49,789,800 AFTER: 50,667,400
Number of Shares Purchased to Date*: 877,600 Total Amount Appropriated for the Buy-Back Program: Up to P200 Million of the Company's common shares Total Amount of Shares Repurchased: PhP4,107,168.00.
Other Relevant Information: On 14 August 2023, the Company's Board of Directors approved the buy-back of its shares with a total acquisition value of up to PhP200,000,000.00. The buy-back program may be executed over several tranches for a period of one year ending on 14 August 2024. * From the date when the share buy-back program commenced.
-
-
Stock Last. shares MktVal. : Orig.: Cost:
WATCH Portfolio, 10.11.23
FILRT 3.00 33,557: 100,671 100.0k 2.98
RCI 0.55 196.08k 107,844 100.0k 0.51
ROCK 1.43 71,429: 102,143 100.0k 1.40
VLL. 1.73 59,880: 103,592 100.0k 1.67
====. ====. 414.2K. 400.0k
Cash ==== ==== 600.0K 600.0k ===:
Watch ==== ==== 1014.2K 1000.k +1.42%
Model ==== ==== 1005.?K 1000.k +0.50%E -
ADDITIONS / Changes :
Monday, Oct.10th: Added FILRT to Watch List at 2.98. (100,000 /2.98= 33,557 sh )
Additions to WATCH : MAXS , wed-thu, 10.12 at 3.99 (100,000 /3.99= 25,062 sh )
and today/Friday, 10.13 I got: LTG at 8.99. (100.000 /8.99=. 11,123 sh )
+ x
+ y
-
SAT PORTFOLIO (PHL). . started 9/30/23
TARGET: I have two small MODEL portfolios here.
My intention is to BEAT PSEI by an average of 1% a month over longer periods - not every month, obviously. Since I targeted this, with my real portfolio many months ago, I have managed to Beat that target. Maybe these two portfolios will do it also.
MODEL Portfolio
BTC. 1.57m 0.1333: 209,281 200.0k 1.50m
MEG. 2.03. 99,502: 201,989 200.0k 2.01
APX. 2.28. 86,957: 198,262 200.0k 2.30
RCR. 4.72. 42,373: 200,000 200.0k 4.72
==== ====: 809,532 800.0k
Cash ==== ==== 200.0K 200.0k ===:
Model ==== ==== 1009.5K 1000.k +0.95%WATCH Portfolio
RCI 0.53 196.08k 103,022 100.0k 0.51
ROCK 1.43 71,429: 102,143 100.0k 1.40
VLL. 1.72 59,880: 102,994 100.0k. 1.67
====. ====. 308.2K. 300.0k
Cash ==== ==== 700.0K 700.0k ===:
Watch ==== ==== 1008.2K 1000.k +0.82%
Model ==== ==== 1004.8K 1000.k +0.48%Combined, M+W: 2013.0.k 2000.k +0.65%
Vs. PSEI. 6,280. 6,321 : -0.65%
Outperformance. : 1.30%MY GOAL is to beat the Index by 1% per month.
The table above is the simplest way to report what is happening.
Maybe at each MONTH END
-
Update, Nov.6th : APX is doing some catch-up: 2.65 +0.06, +2.62% / UGL: $60.61= 4.37% 10d:
PX vs APX: APX / PX : Prem.?= Ratio: ========= : UGL : apx%
11.06.23: 2.65 / 2.87: (0.22)= 92.3% ( - 7.7% disc.): 60.61: 4.37% *11.03 ugl
9.13.23 : 2.50 / 2.75: (0.25)= 90.9% ( - 9.1% disc.): 56.46: 4.43%
7.27.23 : 3.04 / 2.97: +0.07 = 102.4% (+2.4% prem) 59.36: 5.12%
7.03.23: 2.42 / 2.79 : (0.37)= 86.7% (-13.3% disc): 58.42: 4.14%
5.04.23: 3.20 / 3.05: +0.15 = 104.9% (+4.9% prem) 67.47: 4.74%
APX's GAP up filled (or mostly filled) on volatile Wednesday. GAP is from P2.32
APX vs. UGL, 2x Gold: O:2.50, H:2.52, L:2.36, cl.: 2.45, Unch., /UGL ($53.19)= 4.61% 10d:

-
VLL vs.VREIT: at 10.11. 1.73, 1.67

-
xx
C07367: DoubleDragon Hotel101 Global Pte. Ltd. officially opens and... - 1Today, October 10, 2023, DoubleDragon Corporation's subsidiary Hotel101 Global Pte. Ltd. officially opens and formally begins the operation of both its Global Corporate Office and Global Sales Hub in Singapore.
DoubleDragon has purchased a prime office space at the 4th floor of PLUS Building, 20 Cecil street at the heart of Raffles Place in Singapore for Hotel101 Global Pte Ltd's Global Corporate Office. The Global Sales Hub is also located in the same building at the Ground Floor of PLUS Building. The Hotel101 Global Sales Hub in Singapore has the newest version of Hotel101's signature 21 square meter HappyRoom equipped with its worldwide standard features such as the Queen bed and Single bed using Emma Sleep mattresses, IOT (internet of things) App operable smart lighting using one single type of bulb, 55 inch smart TV, work desk, universal power outlets, electronic device charger ports, kitchenette with refrigerator and microwave, and an ensuite modern pre-fabricated bathroom.
For its signature look, Hotel101 has chosen the 'banig' -- the traditional handwoven mat of the Philippines. Banigs are where Filipino families would gather, form lasting bonds and shape memories. The banig symbolizes home, and that's how we want you to feel when you are staying at Hotel101. The Hotel101 banig colors were carefully chosen to radiate happiness and intended to evoke a Filipino touch in all Hotel101 projects across different countries worldwide. The Hotel101 signature modern banig was designed by AI (Artificial Intelligence) to symbolize that Hotel101 will always stay ahead of the curve in technological advances. "If there is one hotel chain that can optimize the use of modern technology in the global hospitality space, we believe it will be Hotel101, given its pioneering standardized signature 21 sqm HappyRooms and asset-light concept globally," said DoubleDragon Chairman Edgar Injap Sia II. "Eventually, when you stay in any Hotel101, no matter what country you are in, for the first time you will know exactly what to expect," added Mr. Sia.
2 /
"The Hotel101 Global Corporate Office functions as the hub for our team members that are based in different countries as we form the right mix of experienced team members that will efficiently lead the expansion of the Hotel101 Unique and Asset-Light business model simultaneously in various countries," said Hotel101 Global CEO Hannah Yulo-Luccini. "We invite everyone to drop by the Hotel101 Sales Hub at the Ground Floor of PLUS Building in Singapore and grab some complimentary Filipino Blend Coffee, just download the free Hotel101 Global Booking App for entry and that's it!," added Ms. Yulo-Luccini. DoubleDragon's Focus:Strengthening the Base, Positioning Globally.The DoubleDragon team has currently two specific and straightforward goals. Firstly for DoubleDragon's Philippine portfolio to fully mature and reach its optimal revenue generation level by 2025. And secondly, for DoubleDragon's Offshore Hotel101 Global portfolio to gain significant market grip overseas by 2025. "Given that the world economy is getting more and more fragile and volatile, we deemed it imperative, that the only way to future-proof itself is to passionately pursue the target of DoubleDragon's revenues to be derived from geographically diversified sources, that eventually over the longterm, we aim that no single country will contribute over 10% of DD's revenue and income," said DoubleDragon Chairman Edgar Injap Sia II. "But of course, your company DoubleDragon Corporation, will remain to be a deep rooted Filipino company at its core forever. And your DD team will never stop at any point, doing its unconditional responsibility, to continually be a significant contributor in Nation- Building, with our common goal towards a first world Philippines," added Mr. Sia. Complimentary Filipino Blend Coffee is available starting today at the Hotel101 Global Sales Hub in Singapore Just download the free Hotel101 Global Booking App to avail*


SAT PORTFOLIO (PHL)
in Makati Prime.com's Philippines Forum
Posted
LIST OF SEVEN, Comments
That 25% RETURN on Builder stocks is most of the sector. People keep asking me for my List of 7 Builders - Basically, the Top 10 but without: ALI, SMPH. DMCI. Average PE Ratio is now 4.0, or less
Stock : Last: Bk.V.: %BV: PER: E.Yld : D.Yld : Div%: LastD ex-Dv
MEG. : 2.01 : 6.64: 30.3% 4.06: 24.6% 3.28% 13.3%: .0660: 10.26
SHNG: 3.58: 8.43: 42.5% 3.77: 26.5% 8.08% 30.5%: .1344: 09.07
+5 more
== Average of 7 : 25.6% 3.96=25.3% 4.72% 18.7% Oct'23
ALI. : 28.65 17.30 166.% 19.44 5.14% 0.99% 19.3%. ?
SMPH 30.70 12.58 242% 25.00 4.00% 0.77% 19.3%. ?
DMCI: 10.26 7.79: 132.% 5.11 : 19.6% 14.0% 71.4%. ?
== Aver. Big 3 : 180.% 16.52=9.58% 5.25% 54.8% Oct'23
BTW, the Builder Stocks were not always PER-4.0, and 25% Earnings Yield. In about 2019, they were PER-9.0 and 11% Earnings yield. These stocks got dragged down by falling Bonds. Meantime, as their share prices dropped, Developers kept pushing up the prices of their new properties. Replacement costs went up, and they spent more on marketing, because they were harder to sell, And once sold, might have to be sold yet again (if buyers stopped paying installments.)