


GenghisKhan
-
Posts
154 -
Joined
-
Last visited
Content Type
Profiles
Forums
Events
Posts posted by GenghisKhan
-
-
Why not start a thread here, and post the occasional chart on it.
I like what you are doing with it
My own Property Diary gets, many hits, but few comments:
Thanks. The method I've chosen brings one big advantage. Each data point in the charts can be read by just hovering over the data point. Much better for sharing information.
I do already try and contribute to this site (and particularly this thread) whenever I have something interesting to say. Will take up the offer to contribute the odd chart also.
-
- per HPC poster
... and GEI poster also

Updated the database to 11 datasets with 6 focused on UK house prices. That couldn't spur on any sort of discussion from a site called House Price Crash which once upon a time used to be a place where people had an interest in house prices.
Not sure if I'm going to bother with it TBH. Will probably give it a few weeks to see if interest develops from elsewhere. Between HPC, GEI and my own blog musings which analyse all of this data my future is turning out pretty rosy. It was just an experiment in trying to give something back but if there is no interest I might as well save myself the site hosting fees.
-
An rather odd conclusion. I think a better comparison would be between the Land registry's final sold prices calculated using the geometric mean and the geometric mean of the Rightmove series. The RM index would then need to be adjusted backwards in time to take account of the time lack of the LR series.
As I stated RM tracks initial asking prices and takes no account of subsequent reductions or even whether a property sells or not. A property can easily be listed at a 50% premium and never sell. THe RM index would still count this datum as valid for the index. This and the fact RM uses the arthimetic mean is why the index is always much higher.
I've seen houses listed at £500k and reduced to 475 to 450 to 425 to 400 and still sit unsold for over a year. RM will count the initial 500k as valid data. This property will never have reached the LR numbers.
If it is possible to get hold of the RM data series it would be worth calucating the GM and from that calcuating the ration with the LR. You would then be comparing apples with apples and not allowing a few statistic outiers to skew the index. This would be a true delusion index. I would expect this to be around 15 -20 % higher than the LR number giving a ratio of 1.15 to 1.2.
As far as I'm aware only the Land Registry release their raw data. Therefore the only 'Delusion Index' I can create is the time adjusted RM Non Seasonally Adjusted Non Mix Adjusted AM divided by the LR Non Seasonally Adjusted Non Mix Adjusted AM. It's far better than anybody elses data that I have seen as at least I'm comparing green apples with red apples rather than apples and bananas. That ratio suggests no 'delusion'.
I agree with you that if I could get the RM raw data we'd be looking at an even better comparator by converting that AM to a GM. Unfortunately I just can't get the data.
-
Nice post GK (very nice).
I haven't checked the data myself, but from your post it looks like a great example of the AM-GM inequality. (i.e. AM always bigger than, or equal to, the GM).
Aint that the truth
 .
.Cheers JD
If you look at the long right tail of the sales data in the post I linked to I also can't help but feel that GM is the right metric in this instance. Makes the LR data sit fairly comfortably with me as an indicator of what's going on in the real world.
-
Rightmove tracks initial asking prices only (when a property is first put on the market). It uses a simple arithmetic mean and takes no account of subsequent reductions in prices. The other track either actual sold prices or mortgage agreements (so take account of any reduction in price needed to make a deal) and some (cannot remember which) use a geometric mean that take more account of the long right hand tail of house price distribution - so tend to be lower.
The difference between rightmove and halliwide/LR gives a reasonable indication of the reduction from initial asking needed to sell the property. However, because of the different statistical methods used by rightmove it probably isn't that actuate but is indicative.
Hi Meralti
Please read my initial link as it gives a summary of all the indices. The Geometric Mean is the Land Registry which then bolts repeat sales regression on top.
The difference between Rightmove and Haliwide/LR does not give a reasonable indication. For example, add a big sale to the dataset and the Arithmetic Mean will move quite a bit where the Geometric Mean will hardly move. That destroys the link between Rightmove and Land Registry. Another example, the HaliWide measures a standard house which has nothing to do with Averages which destroys the link between HaliWide and Land Registry.
If you read the link you'll see I've calculated the Arithmetic Mean for sold properties (dat from land Registry). While not perfect that's far closer to the Rightmove calculation. Comparing Rightmove Average Asking prices with my calcuated Average Sold prices shows they are close to each other. (Look at the second chart).
There is not Delusion. People are paying what is being asked give or take a few %.
-
I get your point: by calling it a "Delusion Index", it suggests it has more meaning that it really does.
With the index now at 150%, it does not mean that Seller's are now offering properties at a 50% premium
to where the deals get done.
Instead, this is a sort of ratio between Green Apples and Red Apples (they are not exactly the same thing)
but they are similar things.
I think the Ratio IS MEANINGFUL, since it shows how the Rightmove figures are behaving in relation to Hali-Wide.
A fat premium tends to get whittled down over time, and there is a tendency for ratio to revert to Moving Averages.
(I plan to post a chart later)
BTW, why do you think Rightmove's index is now at such a fat premium to other indicies?
The problem with Rightmove is that it is meaningless data as far as understanding what is happening to house prices. I feel it's just a way for Rightmove to get free advertising.
For the Rightmove Index to increase all that would need to happen would be an increase in "Boomers" (they have the more expensive housing stock on average as they've had more time to accumulate and now have empty rooms as the kids have left home) trying (they don't have to sell just have to place on the market) to sell their properties compared to the overall population and you'll see index increases.
Similarly, more houses in the South East go on the market and the index goes up. Again, doesn't have to sell.
My point is it's not measuring what's happening to house prices it's just measuring the Average of all houses placed on the market in that month. If you read the article I linked to above (particularly the second chart) you'll see that if you do exactly the same thing with the Land Registry data and time shift to allow for the lag between the two indices you will see that your "Delusion Index" is actually closer to 1. Ie there is no fat premium. It's simply about how the indices are constructed.
It's all about lies, damned lies and statistics...
-
There could be some sharp falls, now that the seasonal influence is waning
Mo. : Rt'mov : London : Rest of UK %chg / Nt'wide : H-oldSA : Halif.SA Hal.NSA: HNindex : mom : DelusIdx
2012
J. : : 224,060 : 438,324 : 146,967 - 0.28% / 162,228 = n/a = 160,907 158,879 : £160,554 : - 0.16% :139.6% :
F. : : 233,252 : 449,252 : 149,658 +1.83% / 162,712 = n/a = 160,118 158,897 : £160,805 : +0.16% :145.1% :
M : : 236,939 : 455,159 : 151,853 +1.47% / 163,327 = n/a = 163,803 163,419 : £163,373 : +1.60% :145.0% :
A : : 243,737 : 464,944 : 152,815 : +0.63% / 164,134 = n/a = 159,883 161,180 : £162,657 : - 0.44% :149.8% :
M : : 243,759 : 469,314 : 152,803 : - 0.01% / 166,022 = n/a = 160,941 161,785 : £163,904 : +0.77% :148.7% :
J. : : 246,235 : 477,440 : 153,332 : +0.35% / 165,738 = n/a = 162,417 163,240 : £164,489 : +0.36% :149.7% :
Jl : : 242,097 : 460,304 : 151,633 : - 1.11% / 164,389 = n/a = 161,094 162,619 : £163,504 : - 0.60% :148.1% :
A : : 236,260 : 454,875 : 150,173 : - 0.96% / 164,729 = n/a = 160,256 160,200 : £162,465 : - 0.64% : 145.4% :
S : : 234,858 : 456,237 : 149,719 : - 0.30% / 163,964 = n/a = 159,486 160,437 : £162,201 : - 0.16% : 144.8% :
O : : 243,168 : 478,071 : 151,123 : +0.94% / 164,153 = n/a = 158,426 159,818 : £161,986 : - 0.13% : 150.1% :
=========================================
mom:+3.54% : +4.79 % : Est. DI : : 150.1% / +0.11% = n/a = :- 0.66% : +0.15% : - 0.13% :.
At 150%, The Delusion Index is sky-high !
Look for some falls in those Rightmove figures in the next few days
Hi DrB
Could I suggest that you might want to stop talking about the Delusion Index. This is because dividing Rightmove by the HaliWide actually has no meaning as the indices measure completely different animals.
The Rightmove is asking prices as we know but importantly is calculated by taking a simple arithmetic mean as properties come onto the market. This means the average price will be affected by price changes but also house mix changes and regional mix changes. In contrast the HaliWide doesn't measure any sort of mean or average. Instead it is simply calculating the price of a "Standard" house. Therefore I don't see how you can ratio the two. Note: Admittedly I originally made the same error.
If you'd like to read more on the topic then this could be a good starting place.
-
Maybe they should seasonally adjust it

That would then take more effort than listing all of the initial asking prices in one Excel column and then typing =Average(A1:AX) in the cell below. It might even require the use of a
Statistician. I'm now even starting to wonder if they actually filter out all the duplicate entries which arise by people listing with multiple agents.
If not we're going to get even more rubbish data with distortions like this. Property 1 http://www.rightmove.co.uk/new-homes-for-sale/property-36028837.html and Property 2 (oh hang on it's Property 1 again) http://www.rightmove.co.uk/property-for-sale/property-33694633.html each listed for £39,950,000.
-
Rightmove out
http://uk.finance.ya...-085421862.html
:lol:Now can we please all agree that Rightmove is the worst of all the indices?
The headline on the RIghtmove site is "Asking prices jump by 3.5%". That is nothing but sloppy sensationalism and possibly down right wrong. I've been trying to understand the differences between all of the indices and wrote my last thoughts here. While I'm still yet to figure out the intracacies of all the interactions between the indices and which one I should be using as my key reference I do know it won't be the Rightmove Index. The main reason is that it doesn't track house prices (even asking ones as opposed to sold ones) at all. It just averages asking prices as properties come on to the market. This means it is actually tracking a combination of initial asking prices, possible housing type mix changes and possible location mix changes making it just about useless.
-
My regular look at UK house sellers attempting to look for the Greater Fool. Key chart:
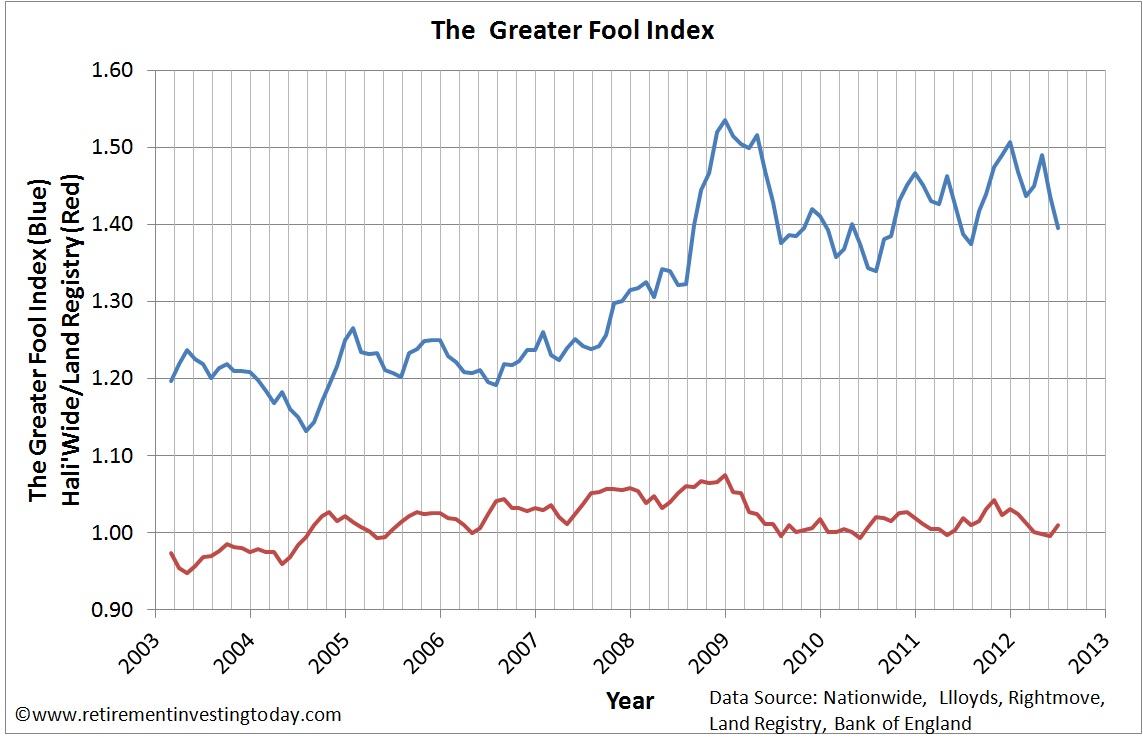
With the full article here http://www.retiremen...rice-index.html
Today sellers still think there houses are worth what they were marketing them for at the peak. Unfortunately, these prices are 40% above what they seem to be selling for.
-
Nice work GK.
Have you based your affordability index based on Net income, Gross, or even Disposable income - once essentials (not including housing) have been accounted for?
Just that Dr B points out that household disposable income has been hit with tax rises and commodity price rises, which could have an effect.
However, I would think that, while there is no doubt there would be some effect, this effect would likely be relatively small, as, although wages have been rising less than inflation during this time, such expenditures do not necessarily constitute such a large proportion of take home pay, especially when compared with mortgage/rent costs.
PS On a separate note, and looking at your specialism, have you got a good link to general info on SIPPs?
Hi JD
Apologies for the delay in replying. Your question on SIPP's prompted me to get off my backside and finish a post that I had been working on for a while. It's here http://www.retirementinvestingtoday.com/2012/08/the-cheapest-low-cost-sipp-self.html Hopefully might give some general information.
For the UK House Affordability work I use the ONS KAB9 datset as the earnings basis. This is the gross average weekly earnings (total pay) for the whole economy and includes bonuses. I haven't considered the increases in tax or essentials within the analysis. Including tax probably wouldn't be so difficult however including essentials would be very difficult as I would firstly need to decide what is "essential" and then build an historic dataset. Right now I don't know where I would get that type of data from.
-
...
Anyone have the figures for the UK?
I used to have them, but lost them when my computer crashed a few months ago
...
I had a good look at GDP per Capita and compared the BRIC's, the PIGS, the UK and the US here http://www.retirementinvestingtoday.com/2012/07/gdp-per-capita-bric-vs-pigs-vs-uk-usa.html It really is quite interesting to watch globalisation doing it's bit. We get poorer while others get richer...
-
A completely useless measure. Why use that?
(You are thinking like Bozo-the-clown, over on HPC - in other words, not really thinking.)
The BEST thing to use is: an index of Net Income per capita,
since that is from whence people pay their mortgages, that's what matters.
And growth in that measure has been poor, less than CPI.
If the prices of beans ( or gasoline, or food ) goes up fast, that doesn't help people pay a higher mortgage.
In fact, slow growth in incomes, plus rapid growth in the price of other essentials, can leave LESS money in people's hands to pay mortgages. THAT is exactly what we have seen.
How about an alternative view which is looking at house prices in terms of affordability. I've had an attempt here http://www.retirementinvestingtoday.com/2012/08/uk-house-affordability-august-2012.html
Thoughts as always welcomed.
-
...
What, the feck, is going on?
...
My latest thoughts http://www.retiremen...ordability.html make me think that we will see no meaningful nominal house price reductions until (if ever, looking over at Japan today) interest rates make significant rises. By my calculations the average UK house affordability has become 26% to 40% cheaper than peak. That combined with government back stops makes me struggle to find a reason, other than interest rates, for a drop.
-
I have a feeling that the £ will at least hold up well until the autumn...
As a long term investor rather than trader I'm starting to wonder if the £ is actually undervalued. Analysis includes the Big Mac Index plus some currency charts since 1971 here http://retirementinvestingtoday.blogspot.c...ndervalued.html
Of course as someone currently trapped in the UK maybe I'm also becoming delusional
-
Exactly. Have you seen Japan - it is undervalued by -37%!
And that's why I have put together a group of 10-11 high powered people (here in HK), who will be discussing the
idea of investing in Japanese property. / see: Japan Lessons
It was also interesting to note that countries which are seen as being relatively prudent - Switzerland and Germany - were also seen as under valued. Maybe the population of these countries has some form of financial education or a decent set of media which educates the masses about boom and bust. Maybe even the concept of value and affordability. They might even have regulators who don't let it get all out of hand and then try and close the door.
-
Seems like some of us need reminding just how insane the UK property bubble is...
It's not only the UK. I run valuation models on both the UK and Aus. The former is where I live (and rent) now and will for some time so look to buy some day. The second is a likely retirement location.
The Economist recently ran some valuations and on their list of 19 countries Britain was number 6 with an overvaluation of 33.8%. Number 1 was Aus at 61.1% over valuation. Full list and some analysis from me
here http://retirementinvestingtoday.blogspot.c...k-property.html -
While checking I noticed AEI is going to be scrapped. You might want to pick out a new measure and start updating your charts.The Average Earnings Index (AEI) is an indicator of how fast earnings are growing in Great Britain. It is no longer the lead measure of short term changes in earnings, having been replaced by the Average Weekly Earnings Statistic in January 2010.The Average Earnings Index will be discontinued after September 2010.
EDIT Link
Thanks for that Ziknik. All I can say is arghh! What is the saying lies, damn lies and statistics. Or something like that. Why do they always have to change the measures that they use. A cynic would think they are trying to hide things. Lucky I'm not cynical however it really does make it difficult to make sensible informed decisions.
-
I've double checked. It does include bonuses.AEI: Whole economy SA inc bonus: Index 2000=100: GBSeasonally adjusted2000 = 100Industry: 01-93Updated on 18/ 6/2010I am surprised to see the rate of growth reducing,
That's great to know. Thanks.
Yes I'm watching the rate of growth slowing with interest. LNMM for April '10 up only 0.5% with RPI at that time sitting at 5.3%. Everyone please take a pay cut in real inflation adjusted terms...
-
Does LMNQ exclude bonuses?
Hi ziknik
LNMQ is the seasonally adjusted Average Earnings Index (AEI) measure. The non seasonally adjusted index is LNMM. I used to always use this index however it has some wild rides. Looking at the months since January '10 it went -0.44%, 4.95%, 7.80% and then 0.51%.
I am pretty sure it includes bonuses and I personally am assuming this when conducting my analysis. It is based on information obtained form the ONS Monthly Wages and Salary Survey (MWSS). If you look up details of this survey it collects total gross pay from individual firms, as well as total bonus payments and any pay award arrears. The reason I'm not 100% sure is this statement on the ONS website "The AEI is based on information obtained from ONS’ Monthly Wages and Salary Survey.". It's the word based that is a little ambiguous IMO but maybe I'm just paranoid.
Here's the 2 links that are relavent so you can get it straight from the horses mouth.
http://www.statistics.gov.uk/about/data/gu...siness/mwss.asp
http://www.statistics.gov.uk/statbase/Prod...2484&More=Y
-
http://retirementinvestingtoday.blogspot.c...k-property.html
I've just run some more research and analysis of the UK property market (link above for full details) which includes:
- The Economist has just run an analysis showing Britain is the 6th most over valued market on their list with an overvaluation of 33.8%. The most over valued country was Australia at 61.1%.
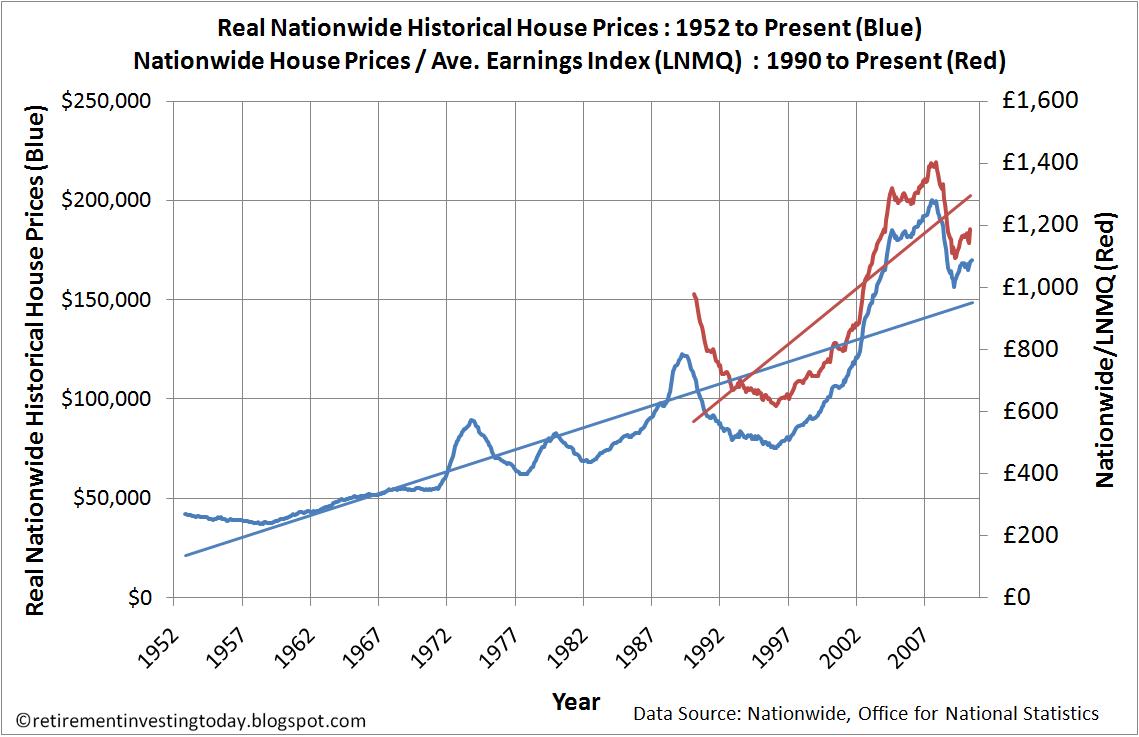
-Using my analysis from the charts above:
--The average inflation adjusted price since 1952 has been £84,716. So with today's price of £170,111 prices could be 50% over valued. Probably too bearish.
-- Ratio of prices to average earnings since 1990 on average has been 930.7. Today it's sitting at 1,189 so maybe 22% over valued. This is my preferred measure as salaries have increased in real terms over the years which would allow house prices to increase in real terms while mainatining affordability. Probably too bullish as since 1990 we've only seen one bear market and two bull markets (one very big one which we remain in IMO).
-
...
Once wages start to rise again in real terms (inflation adjusted) that will be the time to at least consider buying.
...
That's the bit I am struggling to understand. In the press you continually hear about hair cuts, redundancies and as Wander points out freezes. I monitor the average index monthly with the latest (February figures) charts here
http://retirementinvestingtoday.blogspot.c...010-update.html
The surprise. As Wanderer points out inflation at 4.4%. Earnings seasonally adjusted year on year up 5% and non seasonally adjusted up 5.4%. The only thing I can think of is that bankers bonuses were up on last year but surely this can't skew the data of the whole UK to this level. Where else are the increases coming from.
-
House prices make a strong start to 2010
A few questions for y'all:
Do folks still see a UK house price crash eclipsing that of the 1990s?
Does Dr B still see UK house prices hitting an average of 100k? (i.e. a near 40%!! drop from here.)
Or will QE and extended low rates put a bottom in nominal house prices. Please note nominal. Does sterling have to crash for this to happen?
House prices are currently increasing in nominal and to a lesser extent in Real inflation adjusted terms. However in my opinion I think that these increases will be short lived. Salaries are increasing at a rate which is less than both inflation and house prices meaning a pay cut in real terms. Average bank mortgage rates are starting to increase from their lows in June 2009 which will reduce the level of principle that can be borrowed idc. The Bank of England and government are powerless to do anything about it this time (dropping rates further, even negative, QE) without risking the country as a whole (bond strike, hyperinflation etc).
If house prices were return to a level where the house price to earnings matched that of 1996 house prices would be £84,670.
The fear I have now is that the Bank of England holds interest rates allowing inflation to rise quickly (I think they will) resulting in nominal house price increases but stagnation in Real inflation adjusted house prices. This will be dependent on whether salaries start to increase in line with inflation. The private sector doesn’t seem in a position to do this however while government borrowing is at record highs I fear the government will listen to the Unions requests for big increases as they have an election win to try and buy.
I'm staying out of the market for now however as usual DYOR.
Full detailed analysis and a few charts here http://retirementinvestingtoday.blogspot.c...010-update.html
-
Have you read "The Great Crash 1929"? It's one of the classics, perfectly describes recent events.
Also includes the 1925 Florida property bubble...
It's a good read. Written very simply.
 .
.
UK House prices: News & Views
in NEWS Commentary, 2021 & Beyond
Posted
If the market manipulation stopped then we might see an increase. Rates were starting to rise (in fact SVR and Lifetime trackers still seem to be rising, albeit at glacial speeds) before Funding for Lending strated forcing Fixed Rate Mortgages south again. Full details here with chart describing what I'm on about: