


Happy Nihilist
-
Posts
222 -
Joined
-
Last visited
Content Type
Profiles
Forums
Events
Posts posted by Happy Nihilist
-
-
Gold looks to have completed an inverse head and shoulders?

This also seems to be corroborated by Ross Clark's latest analysis on Gold. His roadmap over the last year or so has proved pretty reliable. Link: http://www.321gold.com/editorials/hoye/hoye040710.pdf
Some excerpts:


-
Indeed. Nice chart. I think silver will just continue to bounce up and down against the dollar in this wide range for the short/ medium term.... reflecting the strength of both currencies.
I'm only swing trading silver now. Gold is the one to buy and hold imo.
Agreed. Volatility to be expected going forward, and possibly a sharp drop around the corner? But regardless, remarkable how Silver has behaved technically these last few months.
-
double post
Silver looking vulnerable ? :

-
I've been adding to my core holding each time gold dips below 680GBP. A couple of recent articles suggest I may be in good company?
Expect Gold to gain more than 30% this year - John Embry Sprott
Just beat me to it ;-) Here are some updated graphics from the Hoye / Clark article:


-
If this week is 'make or break' for this current au bull, perhaps the $index also needs to make a decision this week.......
edit - or perhaps next week looking at it again
Indeed, now seems a pivotal moment for markets in general.
By the way, here is a link to Ross Clark's Chartworks I mentioned earlier (published on 13th of Jan): Gold ... Resistance In Place


-
I think we are halfway through this move. I have been saying since Sept 09 that this move will go to around $1350 by around end of March/early April.
Yes, it will be interesting to see how this pans out. I guess the problem with patterns/cycles like this is that they work until they don't. It looks to me that this (and maybe next) week will be important in determining whether this step like progression remains a valid roadmap?
-
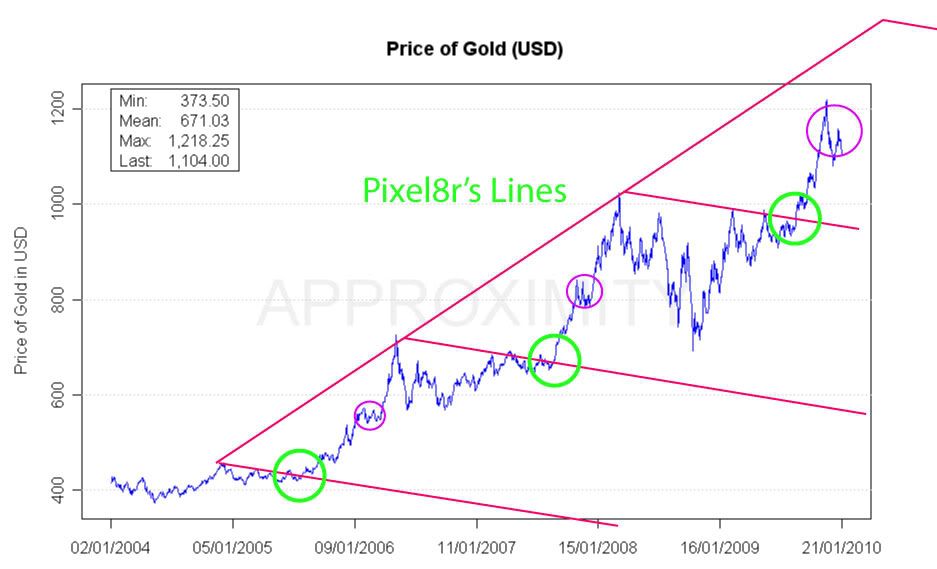
Where are we now? I.e., do we find ourselves at the half-way consolidation phase through a big leg up in gold (Cf. 2006 and 2008 moves), or have we already exhausted the move up in Gold this time round?
From the longer term perspective, it would look entirely healthy if the price corrected to 1045 (34 week moving average) or even 1005 (55 week moving average) from here. But, judging from the chart below, if we did touch the 34 or 55 week moving average, that would suggest the big surge up has already completed this time around. Ross Clark (Institutional Advisors) has identified this week as a likely place where Gold will make an important low and could mark the beginning of Gold's second leg in this move up. Looking at the chart, it seems that this week is indeed make or break for deciding the foreseeable future in Gold. E.g., 34,55,0 MACD is on the verge of turning negative?

-
Some interesting Gold charts I came across.
Looks like the 34, 55 and 233 week moving averages have provided key support levels in this bull market. Interestingly, since 2001, the 34/55 week lines have never crossed. It came close in 2008, but no cigar. Anyway, see what you make of them.
5 year

10 year

-
With the recent move in Silver past its October 2009 high, the short term divergence between Gold and Silver has resolved itself. (On a slightly longer term a divergence still exists as Gold is making new highs but Silver remains below its March 2008 highs, and going back further is well below its all time high of $50/oz). In any case, recent action in the precious metals is looking very strong, so thought I would update one of Ross Clarke's charts as it presents an interesting picture.
From Chartworks 2009/09/07 LINK
The Silver/Gold ratio is approaching overbought territory. In the strongest of years the RSI(14) managed to record levels in the mid-high 80’s (1974, 1979, 1980, 1987, 1988, 2003, 2004, 2006 & 2008). In many other years the RSI of the ratio topped in the 70’s and was followed by a downside correction in the silver price of 12% to 15%. If other technical measurements become excessive then we will use this analysis to assist in determining the depth of the break.
Update 2009/11/16

2 ways to slice the same cake? On the one hand, there appears to be a negative divergence between the RSI and recent price action in Gold and Silver. On the other hand, as Ross Clarke's chart illustrates, Gold and Silver usually reach an intermediate top with the Silver:Gold RSI above 70, so it would be unusual for the move in Gold to terminate with an Silver:Gold RSI near 50. In other words, if we use this chart as a road map, there is room for a significant move up in Gold and Silver from present levels.
?
-
-
Silver does look relatively weak here and is perhaps signalling that the "flood of easy money liquidity" narrative is limited.
That's what I'm thinking.
I am sticking with my 30% because even though it could dip shortly, all is flux in the short term and who "knows" what it will do. That said, I don't see silver as a gamble, as I have a larger macro [meta] view of where it is going. Heraclitus meet Plato.
Does that mean you envision Silver decoupling from the "industrial" trade at some point in the future?
PS: How about Protagoras?
-
that's still on a downward trend if you ask me
You mean the Gold:Silver ratio? I agree it is a bit early to tell for sure, but in my experience, divergences often indicate internal weakness. This is why I find it surprising that while stocks continue higher, gold is making new highs, silver is struggling to gain ground, and the gold:silver ratio is struggling to break down. But perhaps i am speaking too soon and Silver is about to catch up. We will see
-
All is flux. There is no order. Hmmm... then again maybe you could go back and read Heraclitus.
Then again, if there is no order, you could just as easily go forward and read Heraclitus.
I think there is an important difference between the metaphysical concept of temporal order and the pragmatic experience of temporal order (e.g., summer follows spring, spring follows winter etc.). Even if there is no justification for assuming some absolute temporal order, this does not mean that the therefore arbitrary sequence of events (flux) is chaotic or meaningless. Negation does not imply its opposite!
In any case ... back to Silver.
time will tellWell yes, but the point of the graph was to suggest that time has already been telling us something ... but I guess time will tell

-
The fact that Gold is making all time highs but Silver is unable to exceed its October 2009 highs, not to mention March 2008 and June 2008 is a bit of a worry IMO.

And now for something completely different . . .
 Just recently purchased most of Nietzshe's works spread over several books.
Do poeple have recommendations in what order they are best read or is chronological good enough?
I've already read the Anti-Christ.
If you intend on reading most of his works, then in my opinion chronological is pretty good as you get a sense for how his thought develops. The way I tend to view the development is: romantic, positivist, zarathustra, post-zarathustra. But in any case, definitely start with The Birth of Tragedy.
-
I have always half-suspected one more wave up in the inflation trade, one last hoorah, with the ratio closer to 50, before it all turns around.
50 on the Gold:Silver ratio? Interesting. That would imply another substantial move up in general equities.
 [i prefer Dostoyevsky to Nietzsche myself, just finished "The Gambler". A superb read. I suggest "Notes from the Undergound" be made mandatory reading for all first year economics students.... in order to balance out the nonsense of ceteris paribus/ all things being equal. They might then undertand a little about human behaviour.... or there subject at hand.
 ]
]And yes, The Gambler is a great read. I do have a soft spot for Nietzsche though. As Freud (in my opinion correctly) observed, "he had more penetrating knowledge of himself than any man who ever lived or was likely to live."
-
Dip postponed compliments of India.
Brown "put" meet Indian "call" ?

-
A pretty nice summary of the Gold-Silver Ratio posted on Slope of Hope
Gold-Silver Ratio (GSR) and a Whole Lot of Ramblinghttp://slopeofhope.typepad.com/.a/6a00e009...cd2f6970b-popup
The GSR is one signpost that can give us a leg up on impending market events. The lower panels on the above chart show what I mean.
You will hear all manner of cheering by gold bugs when silver is leading gold, and as the first panel shows, when gold began to out-perform silver, the gold miners (HUI) gave a clear indication that all was not well. To this day, many gold bugs seem to think that the gold stocks will escape the coming carnage when the GSR turns up again. Pardon me if I do not go along with this idea in the short term, although beyond a coming correction, I believe this sector is the place to be for reasons I will explain a bit later in the post. But here is the nugget, if you will: The gold miners need the USD to strengthen and the GSR to turn up in order to establish the next leg up in their positive fundamentals and in order to become distinguished from the general commodity/inflation trade that is positively correlated to the economy.
We all remember how well-gamed crude oil was in the summer of '08. This was the final high profile bubble of what was in my opinion, a series of rolling bubbles that made up the commodity (and inflation) mania which led directly to the crash of Q4, 2008. This bubble did not get the memo that the end was near as sincere 'peak oil' believers were about to be hit with the reality of an epic deflationary impulse. Oil was just another play, positively correlated to the economy.
The next two panels are industrial metals and the stock market, which are of course, also items of positive economic correlation. They had their bubble tops previously and acted as we might expect leading into the upturn of the GSR and onset of the crash; they diverged negatively.
The GSR signals the draining of liquidity as the mass speculative urge begins to fade. It rises with the same dynamics that make the USD rise in a bout of deflation. In other words, it rises with the collective need to get liquid, get safe and get the heck out of the casino. So, any bottoming or bullish activity in the GSR can be looked upon as an early warning system on a USD rise and accompanying decline of nearly all asset markets.
But here is what I love about the GSR. While it can give signals to get short certain bloated and hope-fueled markets, the rising GSR also signals that things like oil, industrial metals and even human hopes for prosperity will be declining in terms of gold. I find Prechter's analysis that gold will decline in a deflation therefore so too will the gold mining stocks, to be too simplistic. Gold will probably decline in a deflation, but here are two vital points to be considered beyond the short term:
1) Gold will decline much less than positively correlated items - like silver, like oil, like copper, etc. Gold will decline less than gold mining cost inputs, which means margins at the companies that dig the yellow stuff out of the ground will expand as their product out-performs relative to their costs. The best part is that another epic buying opportunity is likely to present itself even as the miners' fundamental picture improves. Now that's risk/reward I can deal with. I am getting my HUI downside targets prepared, just as was the case in Q4, 2008.
2) I do not believe that a real deflation is going to take hold. Pull up a monthly chart of the 30 year bond and you will see that the 100 month exponential moving average has not been broken. This condition has gone on for decades and it means that inflation expectations have not broken out despite the best hopes of the inflation alarmists. What this actually means is that while deflationists and inflationists duke it out, policy makers are allowed to continue to inflate at will as inflation hysterics inevitably swing back to deflation hysterics. I tried to get this point across recently in this article entitled Yin/Yang, Deflation/Inflation.
My main point is that as long as confidence by the majority remains intact, policy makers will continue their macro game of hide the cheese. They need a deflation event right about now, which will likely be used as an inflationary lever yet again. The GSR is one tool to watch constantly going forward because if that is a bullish consolidation of last year's hysterical upside, the ratio will find support - and a higher low - in the noted zone and that will not be good for any markets in the short term. In the intermediate term it will signal that gold mining companies will be one of the few flourishing sectors as the 'real' price of gold continues its rise, as indicated first and by the GSR and gold's ratio to many other assets.
-
Gary Tanashian makes a compelling case that it is not. He sees a bull flag consolidation in the Gold:Silver ratio, which would imply another strong move up in the price of Gold relative to Silver. Well, at least for the foreseeable future. Perhaps in the really BIG picture your pattern still holds though?
http://biiwii.blogspot.com/2009/10/gsr.html

-
silver is being pushed into a tight wedge - it doesn't want to break through resistance but it doesn't want to go down too much either...
A bearish divergence has developed in Silver vs RSI, MACD and SILVER:GOLD ratio. Typically this would suggest silver is "ripe" for a correction, but obviously it does not guarantee one. Will have to watch this action going forward.

-
@ Goldfinger + RH
Thanks for the caution
Still ... I don't imagine that chap would fare all too well should he be so unfortunate and fall overboard.
-
Welcome to the forum HN. I also suspect we could see a slump in silver sometime soon. I wonder though if we could see a final wave up before the market reverses. I am very overweight silver, so am looking to switch to gold when the ratio is more favourable. Obviously, gold will not be hit anywhere as hard as silver should we see a large sell-off in the market.
The dollar is starting to look awfully cheap and I will be looking to buy it soon with a "peripheral" currency.
Thanks. In terms of upside exhaustion, I guess the catch is that in those last moments the price action is usually most violent (at least for commodities). In terms of Silver, an important question seems to be whether it is part of the "all the same markets" phenomenon, or whether the precious metals sector will decouple from the general market (Cf. late 2007 - early 2008). Although I'm no Elliotician, I am interested to see how the wave count on the S&P pans out. According to the current wave count we would be in the final wave now (see attached chart), with limited upside.

-
Hello,
I'm new to this forum but am a regular listener to Commodity Watch / Frisby's Bull's and Bear's podcasts.
Anyway, I thought I would upload this Silver chart outlining some bearish divergence. Make of it what you will. In my experience divergences don't necessitate moves lower, but they do point out when the price is "ripe" for a fall. For now it seems everyone is too busy ganging up on the Dollar.


 ]
]


GOLD
in Gold, FX, Stocks / Diaries & Blogs
Posted
Touche
Hmm, that possibility had crossed my mind. Bubb's comments about low volume on Gold would also favour another correction in the short term. It is possible (perhaps likely) the pattern fails, but this is why I see 1161.80 as a key level to watch? Actually, on a sort of related note, I was wondering (Cf. Bubb's trading thread) about the timing of the recent conspiracy stories on Gold and Silver. I'm not 100% sure, but was there not a similar hype around May or June 2008, right before the big "take down"? I'd have to go back and check. But that could also fit with your "back to the thin blue line" scenario.
Anyway, Ross Clark's charts seem to suggest that Gold is on the verge of going bubble. According to his analysis, the 1100 level is key to watch on the downside. I suspect it won't take that much longer for this moment of maximum entropy to resolve itself one way or another.