


happy
-
Posts
366 -
Joined
-
Last visited
Content Type
Profiles
Forums
Events
Posts posted by happy
-
-
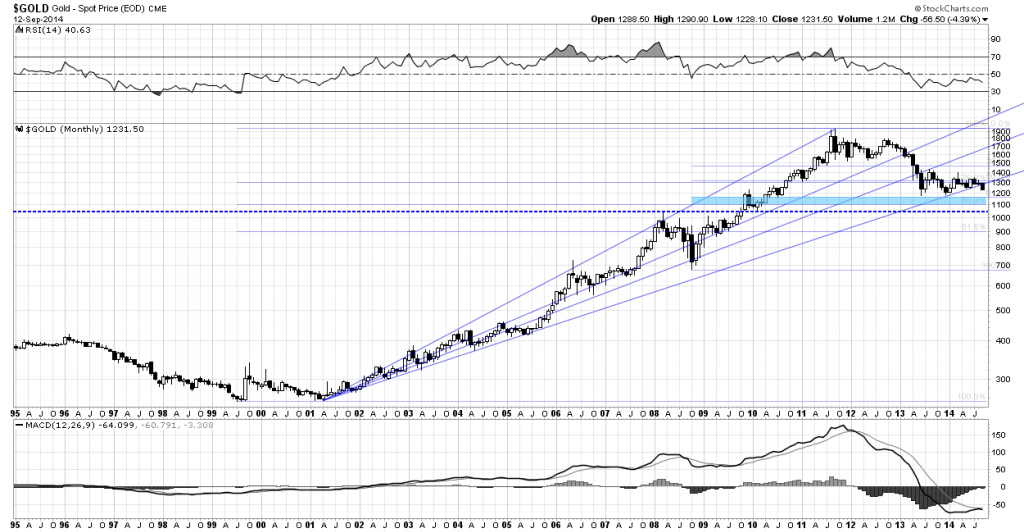
I haven't managed to quantify the edge w/ fibonacci fanlines, however, typically this would constitute a very bearish setup. The interpretation would be as follows: the rejection of the 62.8% fanline confirms the 2011 top in the context of the 2001-2011 bull market.
-
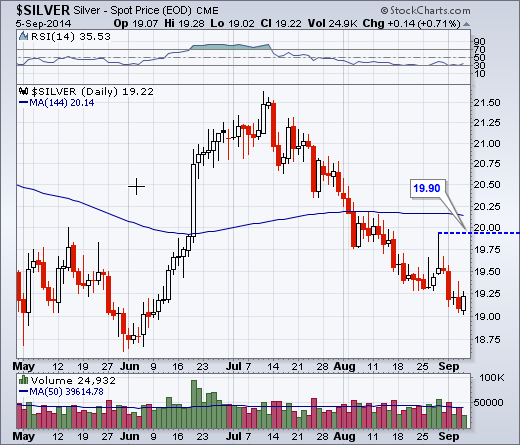
"Looks like 19.10 is the "line in the sand" for the more bullish scenario"
At $19.30, it is now well above that level

Sorry, that was a typo (as per previous post) ... should be 19.90. Anyway, looks like we are due a relief rally at the very least.
-
Just for the sake of contrast, an über bearish view on Silver (funny how often 'elliot wave' and 'bearish' seem to go hand in hand) . .
from Elliot Wave Gold:
Last Elliott wave analysis for Silver (and GDX) expected the trend was down. It turns out this was correct, as it has been confirmed for Gold today.
Although the alternate wave count for Silver is not technically invalidated, I expect it should be within another couple of weeks. I will just present the one wave count for you today, with Gold, Silver and GDX all in alignment.
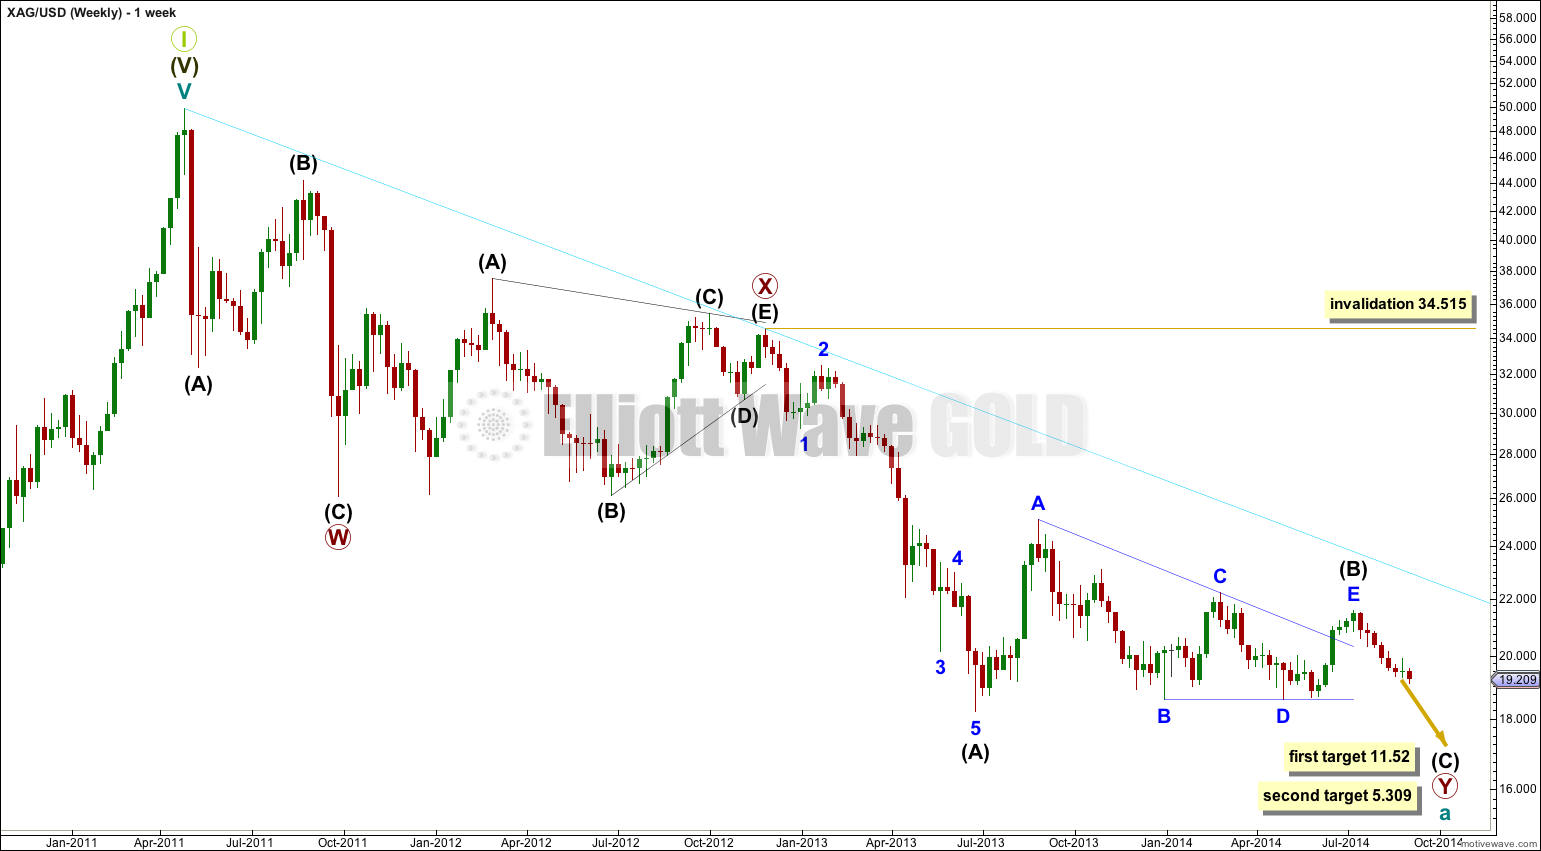
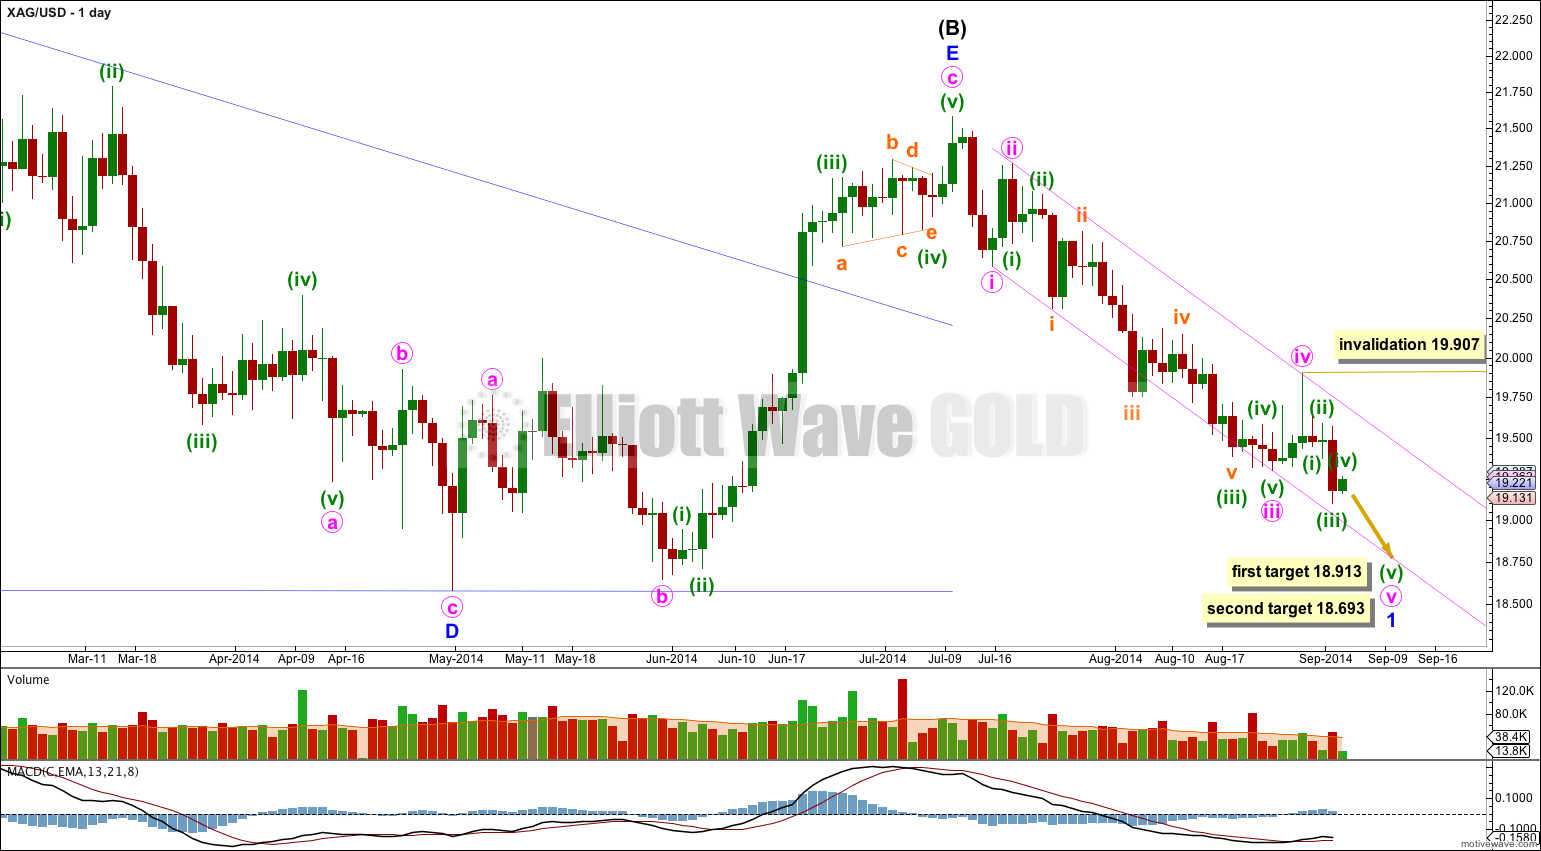
For now minute wave v is incomplete. While it is underway no second wave correction may move beyond its start above 19.907
^ looks like 19.10 is the "line in the sand" for the more bullish scenario
-
latest from Martin Armstrong:
Ecuador hands Goldman Sachs 466,000 ounces of gold worth roughly $580 million at today’s ruling price. Ecuador under its socialist President Rafael Correa is seeking sources of cash after they borrowed over $11 billion from China because they defaulted on $3.2 billion of foreign debt five years ago. This is the consequence of debt and in the hands of socialists-communists, the bonds ultimately are always defaulted upon.
Like Zimbabwe, who had to adopt foreign currency because people will not trust their own, Ecuador is the only country in South America that is using the US dollar as currency. Ecuador did not sell its gold, it effectively borrowed against it in exchange for more liquid assets. Ecuador expects to turn a profit of as much as $20 million on the transaction and it will get the gold back within three years and the central bank expects to turn a profit of as much as $20 million on the transaction without explaining how.
It appears that Goldman will most likely sell the gold forward helping to break the back of gold and will most likely look to replace it at the lows under $1,000.

-
Very good, Happy.
Thanks for the longer term charts.
I do agree that outside the period of 2000-2014, the relationship of Gold-to-Debt may have shifted.
So it is good to see more data on a chart.
Having said that, I don't think the chart goes back far enough:
- so I have added a Gold price section derived from THIS CHART,
- and here's what I got:
Your chart started in Jan. 1980, just as the Gold price was peaking. So if you take the data back further, you will see that Gold prices and debt levels converge sometime (again?) sometime in the early 1970's. And Gold might even be BELOW the debt levels, when Gold was priced at $35-41 per ounce.
I will comment on this further when I have more time, but I certainly think the relationship between these two things is valid, mainly because the amount of Govt Debt in the economy is also a measure of how much money, and how much spending power is in the economy. Do not forget: in a debt based monetary system: One man's dollar debts, are another man's dollar wealth; and if there is more wealth extent, it will likely inspire more spending, and eventually higher Gold prices.
I do appreciate the charts and the discussion here
I don't doubt that the "debt issue" impacts on the price of Gold . . . at times.
The problem is that market psychology, like so many other things, moves in waves. Your call for a significant low in Gold may prove prescient, and yes, perhaps this coincides with a corresponding high in complacency regarding the debt issue. If and when the debt issue again becomes a focus, then perhaps Gold will be a beneficiary.
But this is quite a separate argument from saying that the level of debt directly impacts on the price of gold, or exhibits any meaningful correlation.
-
I agree with you that there is no rational basis for linking to price of gold to the level of US debt. There is a marginal argument for linking the price of gold to the money supply but it is a very very weak one.
Perhaps ... but then one would need to take into account other asset classes as well, very quickly complicating the picture.
-
A NEW SERIES of short videos discussing Gold and Gold share Charts is planned
These will be carried on the new Green Energy Channel :: ( Link )
Here is the first:
"Gold Low before end of July... $500 of easy upside"
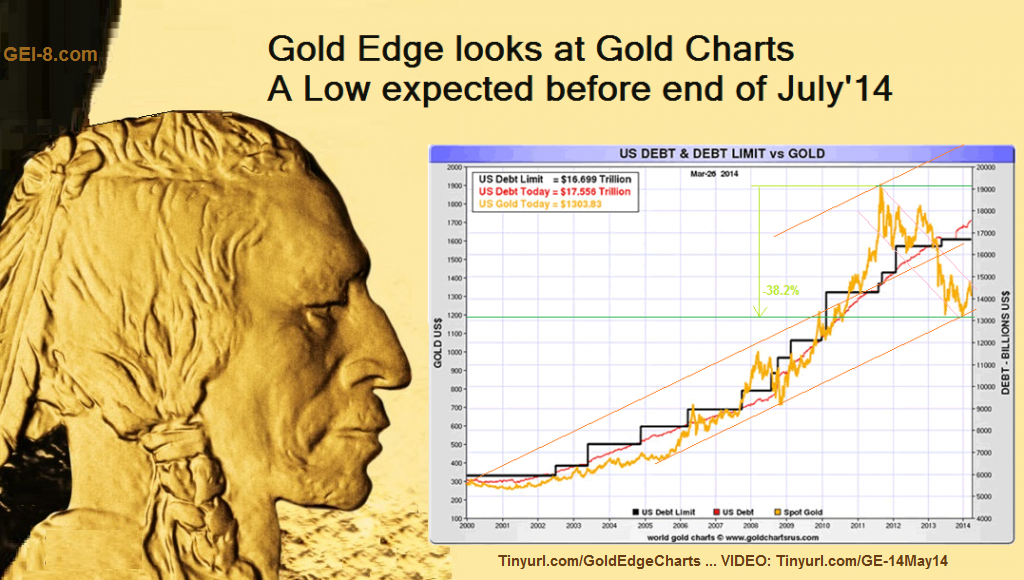
Listen to the explanation of the recent Gold vs Debt chart, here:
Comment:
"Gold Low before the End of July 2014..."
"With $500 of Easy upside."
And that's only if Gold climbs back to the level suggested by outstanding US$ debt. As the debts climb, the upside increases. And if the Gold price moves back to the Top of the Channel, there is $1,000 -1,200 of upside. Or in other words: Gold could rise to $2,300-2,500, perhaps within the next year. Experts like Jim Sinclair and Eric Sprott have predicted gold will hit $2,000 within 2014, so a huge price move may arrive quickly, once the Low is in place."
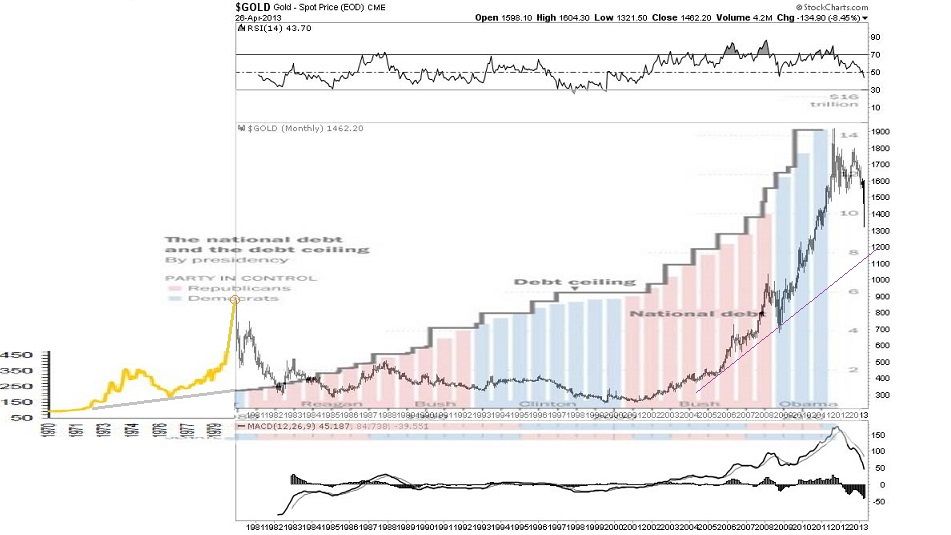
I remember Dominic Frisby posted a version of this chart some time ago (implying a causal link between the US Debt Ceiling and the price of Gold) . . . but really, one should take a step back and look at the bigger picture:
Looking at this graph, it is clear that the US Debt Ceiling only ever moves in one direction (until it doesn't), but this is irrespective of whether Gold is in a bull or bear market! It does not even exhibit correlation, let alone causation.

I understand the reasons for owning Gold, and the US public debt is certainly a contributing factor. But to suggest that the level of US Debt has any meaningful relation to the price of Gold, finds no basis in fact. It is a proverbial red herring. To borrow a line from Gary Tanashian: "Gold is about value, not price."
The question of whether there ought to be a relation between US public debt and the price of Gold, is a completely different matter.
-
Did he catch the Low in late Dec. 2013?
That he did . . .
followed by . . .
and finally . . .

-
-
for what its worth:
-
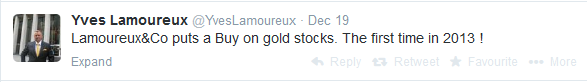
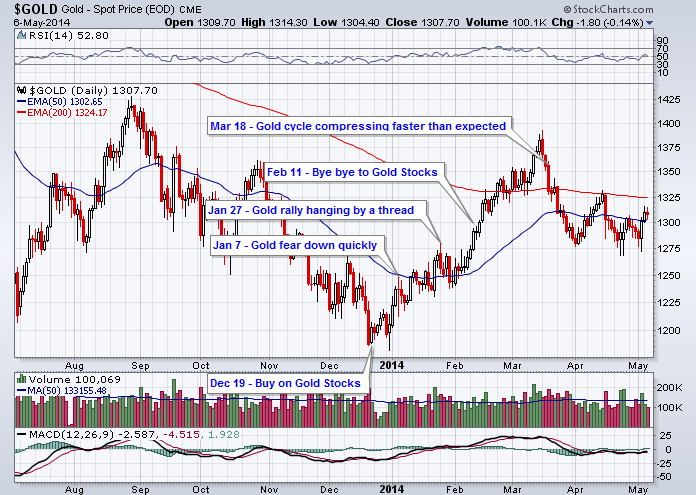
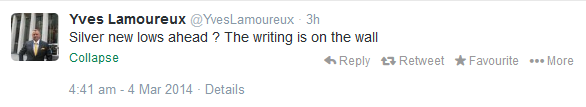
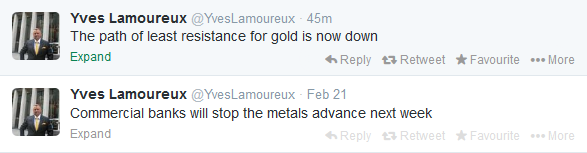
meanwhile . . . Yves Lamoureux has again turned bearish on the yellow metal:
Feb 13, 2014
But also looking ahead, Yves Lamoureux, president of Lamoureux & Co., a market advisory firm based on behavioral economics, said he expects gold prices to fall toward his $1,000 target, as the recent bounce in prices has been “shallower and shorter” than he expected.
“Most of the rebound is short covering and we are shocked at how weak gold has been,” he said.
- LINK
-
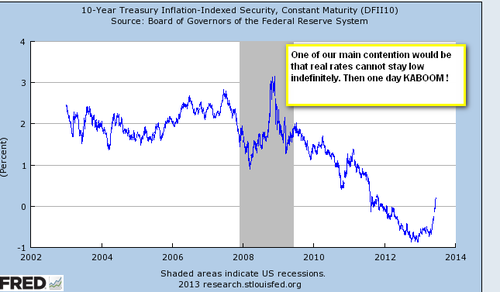
Hoisington: Second Quarter 2013 Outlook
Lower Long Term Rates
The secular low in bond yields has yet to be recorded. This assessment for a continuing pattern of lower yields in the quarters ahead is clearly a minority view, as the recent selling of all types of bond products attest. The rise in long term yields over the last several months was accelerated by the recent Federal Reserve announcement that it would be “tapering” its purchases of Treasury and mortgage-backed securities. This has convinced many bond market participants that the low in long rates is in the past. The Treasury bond market’s short term fluctuations are a function of many factors, but its primary and most fundamental determinate is attitudes toward current and future inflation. From that perspective, the outlook for long term Treasury yields to fall is most favorable in light of: a ) diminished inflation pressures; b ) slowing GDP growth; c ) weakening consumer fundamentals; and d) anti-growth monetary and fiscal policies.
-
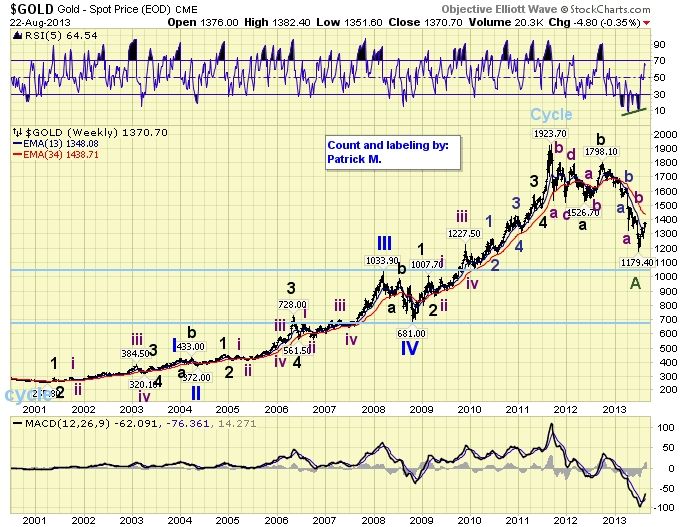
For what its worth, latest Gold update by Yves Lamoureux
Cf., Goldenfreude (15.04.2013) and Gold Road to Salvation (24.06.2013)
Lamoureux's call seems to (roughly) correspond to Anthony Caldaro's Patrick M's Elliot Wave count on Gold
-
via ZeroHedge:
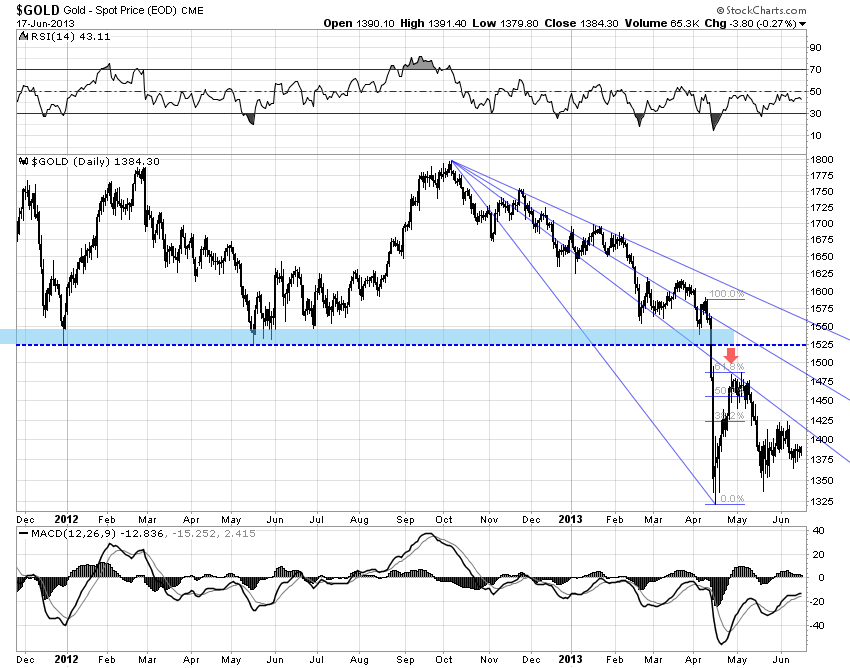
Citi's FX Technicals group is biased to believe that the low in this correction may have been posted for Gold. Here's why...
Two years ago gold bugs ran wild as the price of gold rose nearly six times. But since cresting two years ago it has steadily declined, almost by half, putting the gold bugs in flight. The most recent advisory from a leading Wall Street firm suggests that the price will continue to drift downward, and may ultimately settle 40% below current levels.The rout says a lot about consumer confidence in the worldwide recovery. The sharply reduced rates of inflation combined with resurgence of other, more economically productive investments, such as stocks, real estate, and bank savings have combined to eliminate gold's allure.Although the American economy has reduced its rapid rate of recovery, it is still on a firm expansionary course. The fear that dominated two years ago has largely vanished, replaced by a recovery that has turned the gold speculators' dreams into a nightmare.The above note is probably a close representation of consensus market view at the moment, except that it is taken from an article in the… New York Times, 29 August 1976 (3 days after the corrective low had been posted in 1975-1976 before Gold started a 3 year rally into late 1979/early 1980)

Between 1973 and 1974 the DJIA fell 45%. As the Equity market then recovered Gold went into a corrective phase within 3 months that saw it fall 445 as the Equity market rallied.
This time around gold has in fact been much more resilient.
– It did not peak until Sept 2011 ( 2 ½ years after the Equity market bottomed out)
– It has so far corrected 39% with an Equity market that has rallied 140% off the March 2009 low (DJIA). In 1975-1976 it corrected 44% as the equity market rallied 76%
In 1976 the Gold correction ended in August and the Equity market began a deep correction in September (27% over 18 months). During that period Gold rallied by about 78% and over the 1976-1980 period it multiplied in value by a factor of 8 from just over $100 to over $800. The final part of that rally saw Gold rise from about $470 to $850 over about 4 weeks on the back of the USSR invasion of Afghanistan. Even without that move it still multiplied by about 4.5 times in just over 3 years.
So what are we looking at to increase the likelihood of the “low being in”?

In addition daily momentum is turning up from more oversold levels than those seen before the $270 bounce in 2012. On a daily chart this is the most oversold we have seen since the turn higher in Gold in 2001.
In addition it has become very stretched to the 55 and 200 day moving averages which now have a big gap between them
An important thing to note is that Gold broke its support level the same week as the S&P broke above its 2007 high. As long as the equity market stays resilient (As we saw in 1975-1976) it may be a drag on Gold’s ability to rally substantially. In the 1980-2000 period when financial assets were aggressively rallying, Gold took a back seat. We may need the market to be more concerned about the financial/economic backdrop before Gold can get any real traction again.
The pattern into the low on Gold also reminds us of how the S&P set its low in March 2009

Once the first impulsive low at 741 was regained by the S&P it never revisited it.
A close above $1,322 on Gold, if seen, would look similar
In 1976 the move lower in Gold overshot the 55 month moving average by about 14%

A similar move this time would equate to about $1,185 compared to a low so far of $1,181
The 55 month moving average stands at $1,379
The 200 week moving average stands at $1,459
IF and when we start to overcome these levels from $1,322 to $1,459 our conviction of a bottom being in place will grow. While we remain below these levels (especially if the Equity market continues to remain robust) we cannot rule out the danger that we could get another move lower.
In that respect we would remain focused on the 1975-1976 correction which if replicated could suggest as low as $1,075
-
Some interesting thoughts via John Mauldin's 'Outside the Box': How Gold Lost Its Luster
I have recently started to read the work of Ben Hunt at Epsilon Theory. His ideas are interesting in that he examines markets from a behavioral economics perspective, with ample doses of game theory and history, a combination that few people can bring to the table.
…
Pure gold bugs will be annoyed, but since I am neither gold bug nor pure, I find this a very useful essay. A small taste –
The source of gold’s meaning, whether you are a market participant in 1895 or 2013, comes from the Common Knowledge regarding gold. J.P. Morgan said that gold is money, and he was right, but only because at the time he said it everyone believed that everyone believed that gold is money. Today that same statement is wrong, but only because no one believes that everyone believes that gold is money….
To market participants in 2013 gold means lack of confidence in money, and their behavior in buying and selling gold similarly reflects this meaning. Buying gold today is a statement that you believe that global economic events may spiral out of the control of Central Bankers. It is insurance against some sort of massive monetary policy mistake that cannot be fixed without re-conceptualizing the global economic regime – hyperinflation in a developed nation, the collapse of the Euro, something like that – not an expression of a commonly shared belief in some inherent value of gold.
Thus the Narrative of Gold is still significant, but mostly in contrast to the narrative that has assumed primacy today: the Narrative of Central Banker Omnipotence. Like all effective narratives, says Ben, this one is simple: central bank policy will determine market outcomes.
Then Ben makes a crucial point:
You may privately believe that J.P. Morgan is still right, that gold has meaning as a store of value. But if you participate in the market on the basis of that belief, then you will buy and sell gold in an incredibly inefficient manner. You would be a smart gold investor in 1895, but a poor gold investor today.
This is some of the best, most fundamental thinking about gold that I have seen. But Ben's thesis is larger than that. He wants to understand the manner in which historical correlations and correlation-based investment strategies come under tremendous stress in markets undergoing structural change. "I get VERY nervous," he says,
when I am told that … a socially constructed behavior such as the assignment of value to highly symbolic securities is "timeless and universal", particularly when the composition and preference functions of major market participants are clearly shifting, particularly when monetary policy is both massively sized and highly experimental, particularly when political fragmentation is rampant within and between every nation on earth.
[The full article 'How Gold Lost Its Luster, How the All-Weather Fund Got Wet, and Other Just-So Stories' is attached following Mauldin's introduction / overview]
-
-
-
CHANGED FORECAST / Latest from 29. May, 2013 transcript
Glenn Neely said:I've had to make some adjustments of what's happened since then and where we stand because the 2000 peak produced a big correction, and of course, the 2007 high and 2008 period created an even larger correction, which was the largest since the Great Depression. It changed the way I'm counting this in detail. It does not change my long-term forecast. I still think we're going to 100,000 by 2060 and maybe even up to 200,000 or 300,000. It just changes the labeling a little bit here and there.… That's the bigger picture and how I'm correlating it to the long-term count. It's not as important if the count from 1982 to 2000 or 2007 is correct. What's really important and where the focus should be now is from 2007 forward. There's virtually no doubt in my mind that we're in a corrective pattern.
That corrective pattern is in the B wave. The B wave phase is very close to ending another corrective pattern. We're ready for another big decline. That's the important thing to realise for the short term and preparing for the next economic downturn.
…
{paraphrasing}
scenario 1) "I don't think it's the best option anymore"
1982 - 2000 = Wave 3, currently in expanding Wave 4 that projects "a C wave drop back below 2009's low".
scenario 2) "my preferred scenario"
1982-2007/2008 = Wave 3, currently in expanding Wave 4 correction that projects to "a higher level, not at the level of 2009, but late in 2009. I think it was in October."
... Toward the end, you get this break above the top of the channel or what's called a "throw-over." You get a lot of excitement, media frenzy and prices just advancing very quickly. We're getting into that right now. … We're going to peak this year, probably mid-year, give or take, and that'll be the end of the B wave rally. By the end of the year, we'll start the C wave decline. … The decline in 2007 and 2008 was just over about a year and a quarter. It [the anticipated correction] would be more like a three-year decline in total. It may be two and a half or something like that. It should be slower, but it could be larger in price. It should definitely be similar in price. It doesn't mean we're going to break the 2009 low, but we should easily get to $900. … Then that would be a generational buying opportunity.
... I'm not sure how it's going to all pan out. What is very obvious to me and almost definitely certain is that the B wave rally will be coming to an end pretty soon and the C wave decline is going to last two to three years. It's going to retrace about 50% of current levels, so from $1,500 to maybe $800 or $900. Then from there, we may start another big rally.
... Generally speaking, the stock market is going to top sometime in the next few months, probably around midsummer, give or take a month or so. That will be the end of the bull market that we've seen from the low in 2009, and we're going to start another big bear market similar in magnitude to the 2008 or 2009 crash. It'll be a slower decline but similar in size.
-

If we use this comparison, then it looks as though we would currently be somewhere in 1976. And for sake of further comparison:

-
Well, historically we have seen this reversal before:

^See the circled areas
Nice chart.
-
from Yves Lamoureux thread:
latest from yves via yelnick: http://yelnick.typep...-salvation.html
Yves Sees Forward to Gold Road to Salvation
As panic sets in, Yves Lamoureux is preparing his next bold call. As reported here, he called the peak in gold before other pundits saw it, and made other bold calls that have him now referred to as the new bond and equities guru. Here is a copy of his Feb 8 newsletter on point: Download Lamoureux_Finally Why Gold Will Be Rigged Higher.
His most recent views on economic conditions are summarized in this postfrom several weeks ago. We now have hit the inflection point he predicted. The reversal in bond rates is truly stunning:
The next phase of global volatilty is a surge of liquidity from a final central bank effort to prevent the reversal of rates and unwinding of all their efforts since the Global Financial Crisis of 2007. Yves expects this Financial Surge will float all boats, including gold.
The pattern he saw in gold back in 2010 is now coming to an end, although not imminently. He recommending going long on the Euro and short on gold when the consensus was short Euro long gold. He remains a Euro bull for now, and will be super bullish on gold at the right time. Watch here for his guestblog when the time is nigh.
-
Yves Lamoureux not quite ready to be bullish on gold just yet
-
from Yelnick :
Is Japan Signaling the Beginning of the End?
Since The Bernank spoke last week, the Japan markets have been in turmoil. Stocks have fallen over 12% in just a few days, and, most troubling, bond rates have risen sharply. See chart, courtesy
Zerohedge:
Is the Bank of Japan losing control over rates? The theory of QE is that the central bank can manage rates down by purchasing bonds, but the bond vigilantes in Japan are pushing back.
In the US the fear is that the Fed will be unable to taper off QE. The Bernank's remarks last week were of a taper, and yet in the US the 10 year has spiked above 2%. There is a concern that if rates go above 2.2-2.25%, the biond portfolios will begin to rotate their mix of long and short bonds, essentially causing a spike in the ten-year which might shoot it to 2.5% - the so-called
Bond Convexity. If this happens, expect the Fed to stop the taper and jump back in with (say) two months of QE in one month, to drive rates down.This would be quite a good buying opportunity of the ten year. It also may signal that even the Fed will face issues in trying to taper and avoid losing control over rates.
-
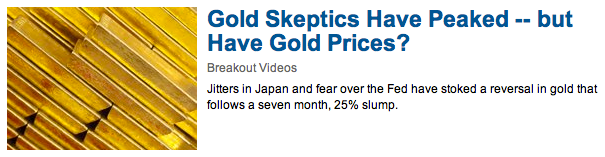
Gold Skeptics Have Peaked but Gold Prices Haven’t: Paul Schatz
It didn't take much to bring beleaguered gold traders back from the brink. Jitters in Japan and fear over the Fed have stoked a reversal in gold that follows a seven month, 25% slump.
While the most widely traded metal is still only about $25 away from the two and a half year low it hit in April, Paul Schatz, president of Heritage Capital, thinks there's currently a lot more upside than downside in gold.
"This is probably only half or three-quarters of the way done," Schatz says in the attached video of the long-term rally in gold. In fact, in a recent note to clients he wrote, "I do not believe there is enough evidence at this time to conclude that the secular bull market in gold has ended."
What that means, Schatz predicts, is that "if you give gold 3-5% on the downside, I think your upside is probably 15%," which would push gold north of $1500 again. Not only does he think it is "way too early" to give up on gold given what's happening in Japan and Europe, Schatz thinks most investors have it wrong.
"I'm a very big believer in the masses being embarrassingly wrong at major turning points," Schatz writes to clients, adding that the skepticism about the metal's future has gotten ahead of itself.
"The sentiment right now in gold is worse, more negative from 'mom and pop,' or the average person, than it was when gold was $235 an ounce," he says. "This is the all-time most bearish sentiment ever in gold. You can't find any time where people were more negative on gold," says Schatz.
His contrarian advice is simple.
"If you give it a little room I think the next big move in gold is to the upside."


GOLD
in Gold, FX, Stocks / Diaries & Blogs
Posted
And for the moment the 30 year / 2 year spread remains in a downtrend, which, judging by the correlation = negative for Gold