HPCsoYESTERDAY
-
Posts
1,200 -
Joined
-
Last visited
Content Type
Profiles
Forums
Events
Posts posted by HPCsoYESTERDAY
-
-
I think that $50 is on the cards for September and once we are through it it will act as support, bit like the $1000 level for gold.
why next month in particular?
-
.../....
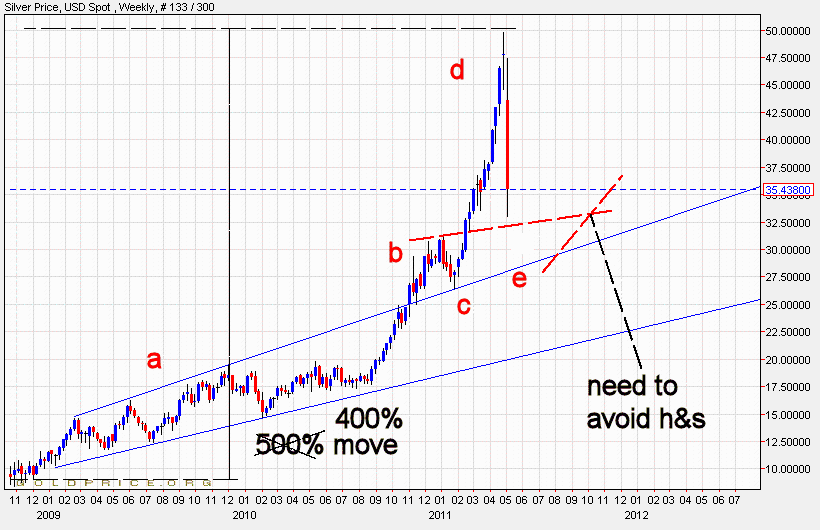
a – confined to an upward channel
b – breakout of channel resistance
c – testing channel exterior as support
d – rising fast and ultimately too quickly
e – violent move down and ultimately re-testing channel exterior as support
f – and the bulls have it
g – hitting long-term trendline resistance (see previous charts in original thread for palladium)

..../...
.../...
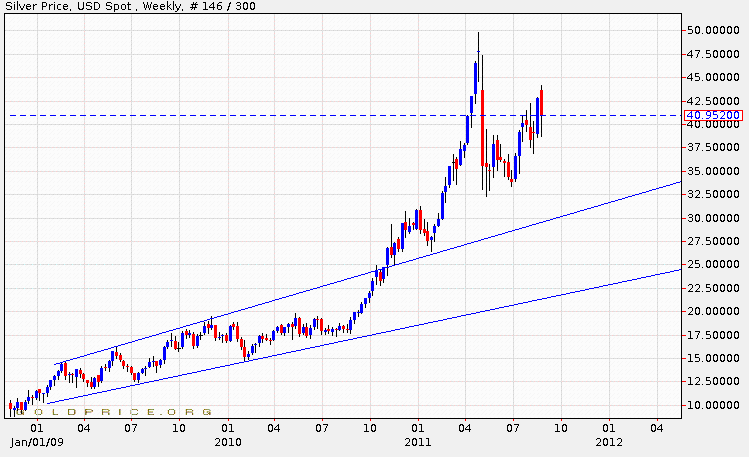
How to test this going forward: First and foremost, if silver is replicating the action in palladium, we need to see a h&s pattern avoided in this consolidation period. Furthermore, it took palladium approx. 5 months after the intermediate high to get back to the same level. This would equate to the silver price being approx. $50, 8 months from now.
..../...
UPDATE:

so far so good - h&s being avoided, $50 on the cards for XMAS
-
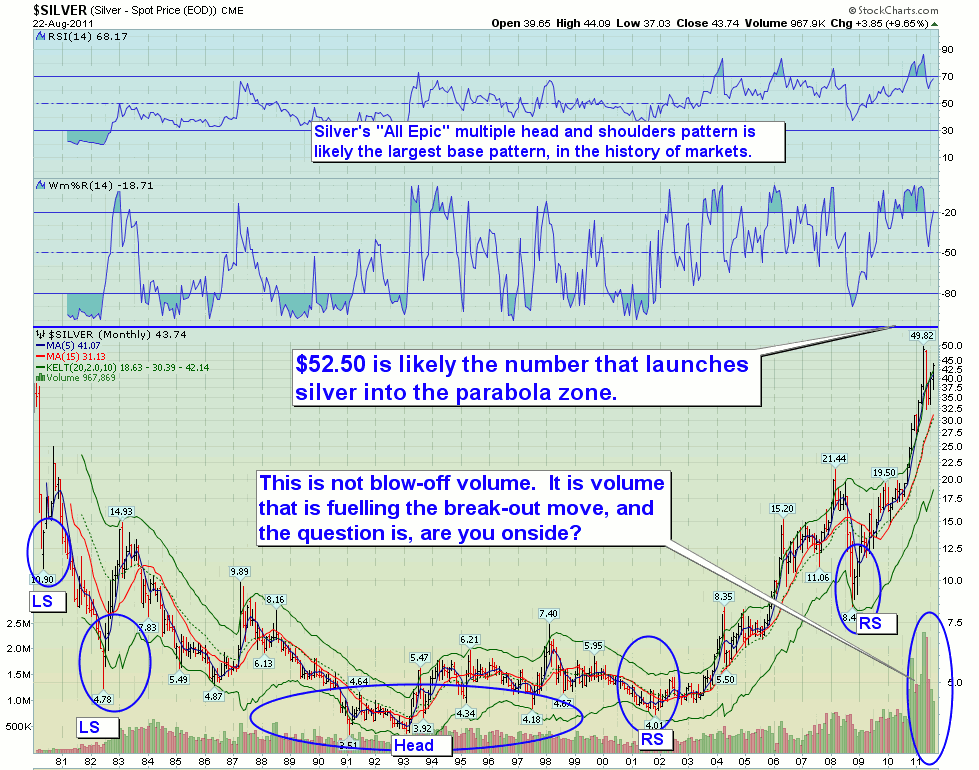
What about the 32+ year chart? That seems to indicate an epic inverse head and shoulders base as indicated by Ross Clark earlier this year.
a longer term chart courtesy of S.Thomson:

http://www.321gold.com/editorials/thomson_s/thomson_s_082311.html
-
-
Hi warpig - in the mid term, yes
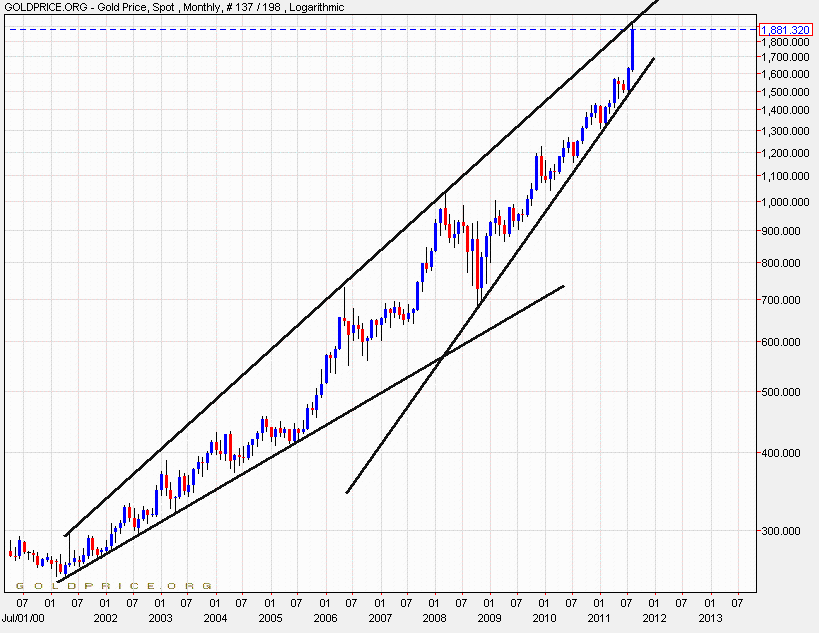
However, in the longer term (next few years) I think the chart portends a dramatic shift in price movement. A symmetry exists between 2001 - 2007 & 2007 - Now, in terms of the variance of price movement. As you can see this variance is now narrowing and hence gold has to eventually break this pattern. It will be interesting when it does!
to clarify:
the narrowing of variance is % price movement over time
'a dramatic shift in price movement' from what we have seen since 2001, could be:
1) a flat price (such as a gold standard),
2) an upwards break through the log resistance (probably accompanied by a dramatic collapse of the $),
3) or a dramatic decline in the price of gold (such as following a multi-year peak)
take your pick!, the point is, whatever's coming, it's coming soon enough
-
DA - Your chart makes it look as if it's due a pullback, do you think that's likely?
Hi warpig - in the mid term, yes
However, in the longer term (next few years) I think the chart portends a dramatic shift in price movement. A symmetry exists between 2001 - 2007 & 2007 - Now, in terms of the variance of price movement. As you can see this variance is now narrowing and hence gold has to eventually break this pattern. It will be interesting when it does!
-
-
-
-
fit - perhaps you might want to post on 24k for a few days? until RH can find the dummy he threw out his pram
-
-
-
i have had this piece of music in my head for 2 weeks now and couldn't work out where i'd heard it until tonight that is......
beautiful
-
-
nice picks warpig - ripped 'em and added as running trax
edit - i'll add a couple whilst i'm here
http://www.youtube.com/watch?v=JoVKLAgS3Ak
-
a bit too mainstream for some on here perhaps, but just one fucking belter of an album regardless
http://www.youtube.com/watch?v=RxmH4v0DJiQ
-
-
-
-
http://www.youtube.com/watch?v=xVNivk0_3_c
http://www.youtube.com/watch?v=jSjCGurcVE4
i saw ride at salisbury arts center (88?) when the second 'play' ep came out - the cover featured daffodils, so before the gig about 4 of us raided every available garden nearby of the prized daffs and then proceeded to the gig. Needless to say the first few songs were accompanied by a blaze of daffs being thrown; i got onto stage for the obligatory stage dive and decided it would be a good idea to pick up as many daffs before i leaped, however, i had accidentally picked up the lead guitarists amp lead as well, luckily i noticed before i jumped, but it was a close call!
-
check out broken doll for starters - this outfit have a touch of the spacemen three about them
-
-
-


The Best of Youtube - Music
in Gold, FX, Stocks / Diaries & Blogs
Posted