


Perishabull
-
Posts
3,447 -
Joined
-
Last visited
Content Type
Profiles
Forums
Events
Posts posted by Perishabull
-
-
I'll answer my own question:
"The Sprott fund is down 3.8% in mid-Thursday trading at a time when the iShares Silver Trust (SLV) is up 0.3%. What gives! You ask. Sprott priced a follow-on offering of 18.1 million shares at $11.05, for proceeds of about $200 million, or $230 million if underwriters exercise their over-allotment option. Judge the offering by its relationship to the net-asset value, which stood at $10.71 as of yesterday, or a 7.2% premium to the market value, according to CEF Connect. The offering priced at 3.2% above last night’s NAV.
In plain English, Sprott turned some of the fund’s premium into cash it can use to buy more silver in the future. And it got a better price for the shares than the value of the underlying assets."
Ended up buying a teeny bit more at $11.01!


AGQ actually closed the day up 0.68%
I got into PSLV 4 days after the debut (low premium) and sold it (too early) for about a $2k profit.
You know although I sold that too early I sold half my physical silver at the top and bought puts and rode them down to $35/$33.75 (covering way more than the remaining physical) and yet although I've done amazingly well with silver I still wish I bought more puts. It was the perfect trade, it would have been even more perfect if I'd bought more puts though...(that's hindsight of course)
-
Its a shame that it will not draw the stddev lines for this new chart.
I didn't mean for you to go doing loads of extra chart work. I feel a bit guilty now.
I don't class this as work! I love markets, trading and analysis. Yeah so you can visualise the 1st standard deviation line on the last chart as essentially being right in the middle of the two upper lines.
Some traders are chatting on TD Ameritrade live chat and seem pretty bearish, one talking of buying loads of SLV puts, another saying he is long gold and short silver right now.
The SLV put buyer;
"If we break $26 I make a bunch of money"
Makes me laugh, he's only $22 too late, lol
The guys a maniac, he's bought loads of SLV puts with a $20 strike price. That's just ridiculous.
-
on your chart, you've drawn the linear regression line and the stdev lines above and below. i get that. i see that on this chart in the august of 2011 the price touches the stdev above the mean. my problem in understanding your point is that the regression line (and the stdev lines) are derived from data spanning 3 years to the present day ie, includes a great deal of data that did not exist in the august of 2011.
what i am trying to ask is whether or not you are talking about the price in august 2011 being 1 std dev above the regression line on a chart comprised from data three years up to august 2011, rather than to the present day.
The previous chart displays the price on 23rd August 2011 touching 1 standard deviation above mean line using data for 3 years up to when the chart was posted, therefore it does include data after 23rd August 2011. Silver touched $44.275 on 23rd August 2011.
Using a different system I've charted Linear Regression from 3 years up to 23rd August 2011 (note this is on SLV as I can't get futures on this other system);
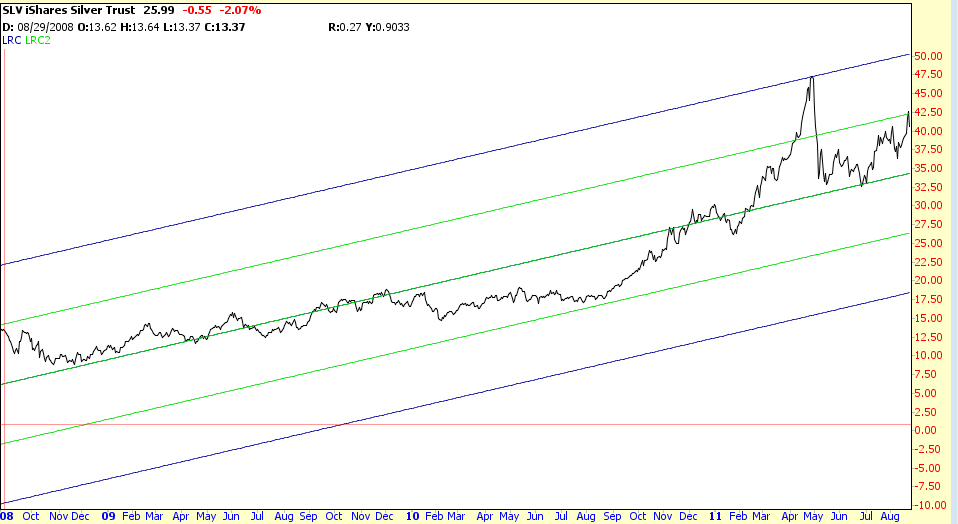
It's important to note that the upper/lower mid lines (light green) on this chart are not 1 standard deviation (not sure how to do that with this other chart system). These are 50% from mean. 1 standard deviation at that time would have been at around $45 on this chart of SLV (probably about $46 for silver futures).
The regression lines are calculated and drawn automatically by the system.
-
http://www.businessi...collapse-2012-7
"Technical Chart Shows Major Opportunity Betting On A Gold Price Collapse" !
That made me think of Ker Nulov;
This next piece is from his blog on Seekingalpha.com;
"Gold for Bears: Weekly trading ranges
Bear case
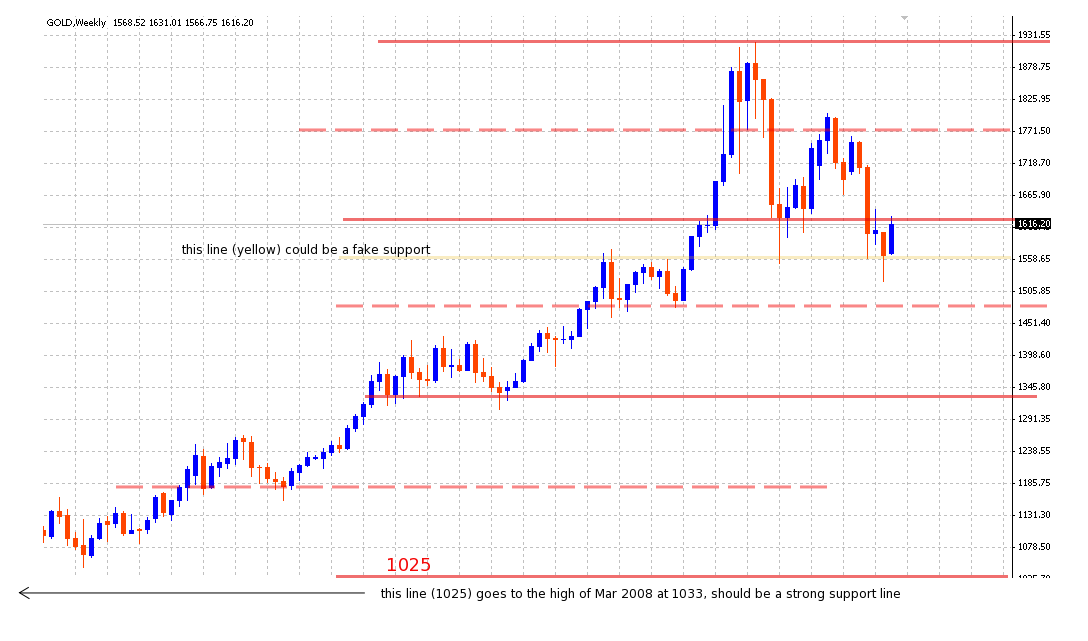
and Bull case
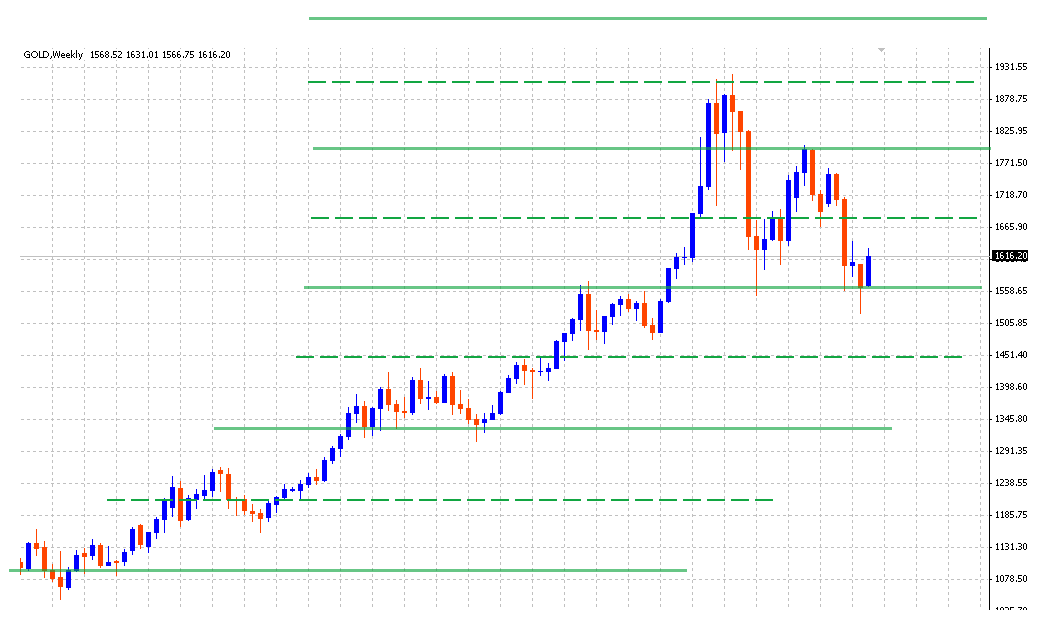
It is a tricky situation, it may be bullish or bearish, you don't know until it breaks in either direction. Since the monthly trend is down, downside is more probable.
My target for the down move this month is 1180 because it stands in the middle of the range. Will allow gold to retrace to 1300 before selling more
Note: I use closing price for all lines except the highest one, median lines (dashed) are allowed to traspass closing price"
-
Silver futures with volume profile - 1 year;
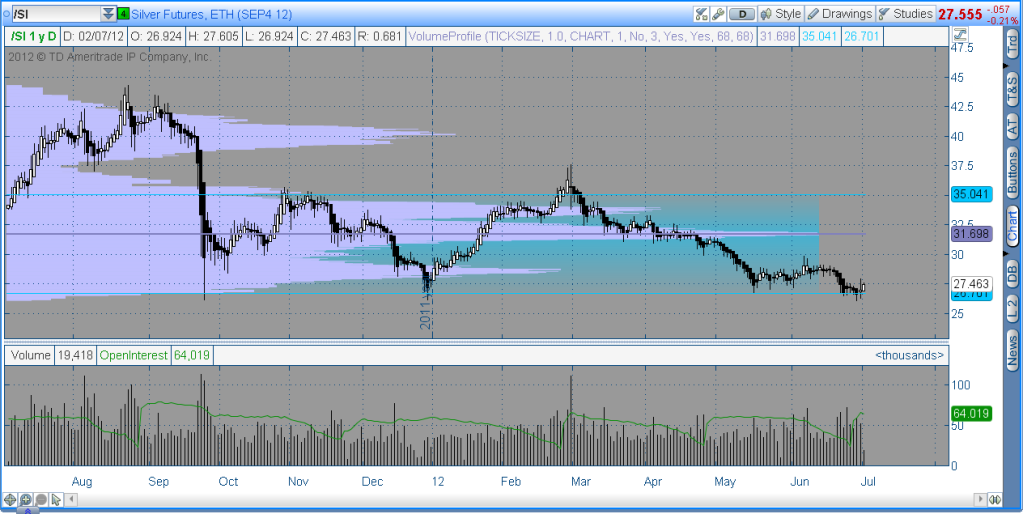
The value area (where 68% of volume transacted) across the last year is between $26.7 and $35, with most of the last 12 months' trade occurring at $31.7.
Silver futures with Linear Regression - 3 years;
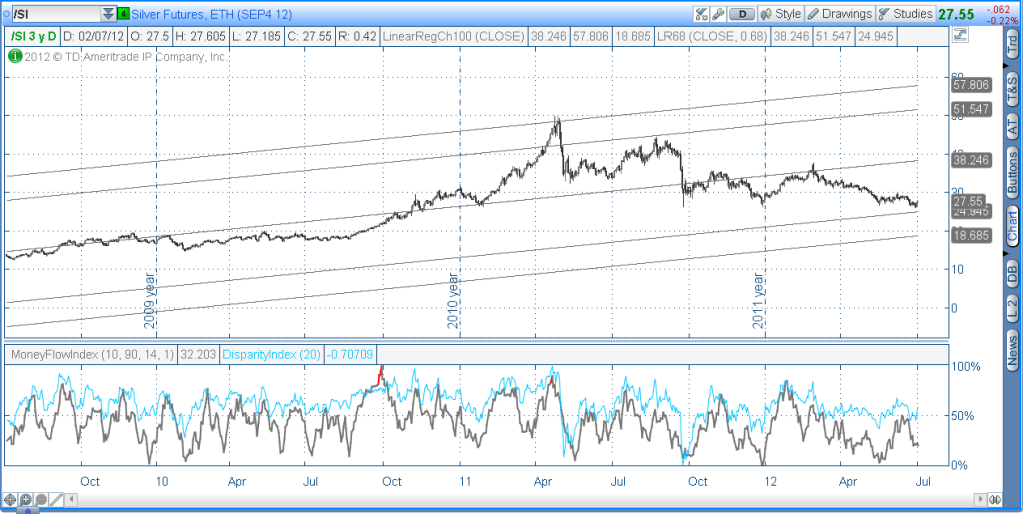
On this metric silver is nearly one standard deviation below mean, when it reached 1 standard deviation above in August 2011 strong resistance was seen at that level. 1 standard deviation below is currently around $25. It'll be interesting to see if it ever makes it back down that far...
-
Forgive me but I did not ask how to tell if silver DID NOT hold $26. I could probably figure that out by looking at the current bid and deciding whether the number was less than $26 or not.
I wasn't sure what you were asking, can you elaborate?
-
How will you know when it has held 26 ?
Well what I'm saying is that it just seems obvious (from a trader's perspective) that because it has held that level there are likely to be a large cluster of stops beneath that level. Of course we may never find out for sure if it doesn't go through $26 but if it does it might look something like this;
Stops triggered on gold from a Zerohedge piece back in Feb;

A very sudden unbroken move (ie a chain of orders being set off, setting off further orders etc etc)
-
A fat finger? Someone's buying immediately corrected by the market.
-
:-)
Liquidation. From whom?
It may refer to forced liquidation from leveraged traders. Since silver has come down to $26 a couple of times (and more recently quite close to it), there are likely to be a large number of stop orders clustered beneath $26. If those are set off during another downswing it could tigger a mini-cascade lower but I would be surprised if it went down as far as $18 in the short term, maybe $22.
Although I don't own any (and haven't for a while) I would prefer to see it hold at $26 since breaking that level wouldn't augur well for the precious metals complex, and I own gold instead of silver these days.
-
Wouldn't be surprised to see silver complete a bottoming process over the next few months... even down to say 25 from where it would then slowly climb back to the 40s over a good year or so. Then perhaps a spike on 'inflation expectation' in 2014.
The gold/ silver ratio - still relatively low - is also perhaps signals a bit more deleveraging.
With all due respect RH, I feel that silver is now a "constant busting flush", that is, when it raises it's head, it's gets flushed by the hedge funds. It's no longer below the radar.
-
What's your position on silver Bubb?
-
Sometimes it can be useful to remove the fluctuations in the value of the dollar from an underlying, to get a different view of things.
Gold divided by the Dollar Index;
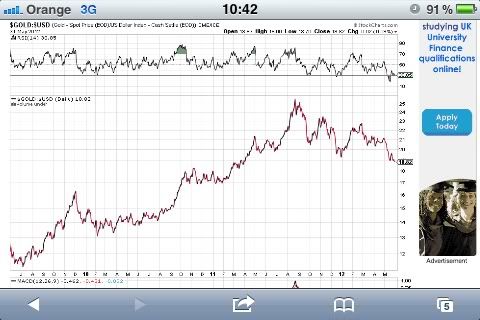
Compare to a standard gold chart;
On the standard chart, gold hasn't conclusively broken through the previous low whereas with the dollar stripped out, it has. So gold is supported despite the stronger dollar. $1500 has to be a very important number, psychologically for gold, if that goes there could be a strong wave of selling, along with sharply lower valuations for the mining equities.
-
Tumbleweed here?
That's good - that's bullish, I reckon
Yeah I post it when there have been a few days of non posting, last time it was 10 days before the low.

Then for gold;
Boring day today for POG. Forget the rockets, it needs one of these.

The tumbleweed indicator.
-
-
excerpt from ft.com;
"Japanese pension fund switches to gold
Okayama Metal & Machinery has become the first Japanese pension fund to make public purchases of gold, in a sign of dwindling faith in paper currencies.
Initially, the fund aims to keep about 1.5 per cent of its total assets of Y40bn ($500m) in bullion-backed exchange traded funds, according to chief investment officer Yoshisuke Kiguchi, who said he was diversifying into gold to "escape sovereign risk".
The move into a non-yielding asset comes as funds in the world's second-biggest pension market are under increasing pressure to meet promised payments, as domestic interest rates remain rooted near zero. This year, the first of Japan's baby boomers turn 65, becoming eligible for payouts.
Mr Kiguchi said the lack of yield was a concern for the fund's investment committee, but he persuaded them that "from a very long-term point of view, gold may be one of the safe currencies". He added that he had sold Australian dollars this month to meet his initial target allocation for gold for the fund, which has 20,000 members.
Mizuho Trust & Banking, a unit of Mizuho Financial Group, has begun to offer investment schemes allowing smaller pension funds to invest in gold.
While few fund managers are counting on a crash in core assets such as Japanese government bonds, said Takahiro Morita, head of the Tokyo arm of the World Gold Council, a producers' association, they were increasingly receptive to the idea that gold could act as a buffer against shocks. "Last year's tsunami and the eurozone debt crisis shows that it was wise to expect the unexpected," he said.
Historically, institutions in the $3.4tn Japanese pension market have clung to traditional assets. Bonds accounted for 59 per cent of industry assets in 2011, the highest share in the world, according to Towers Watson, a consultant. Just 6 per cent – the lowest share – was invested in alternatives such as property, private equity and hedge funds.
Within Japan the image of gold has struggled to recover the lustre lost after a scandal in the mid-1980s involving Toyota Shoji, which duped thousands of elderly investors by promising gold bars that were never delivered. Now, though, households are showing more interest."
-
Gold sentiment is plumbing those depths again (similar story for silver);
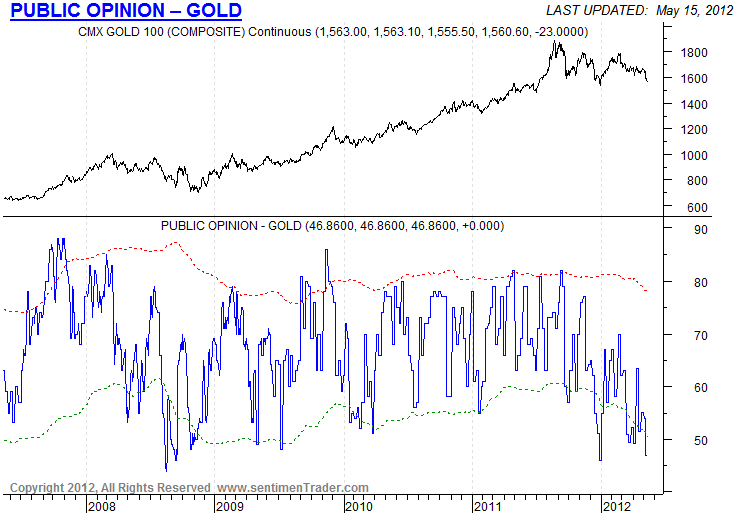
Chart from www.sentimentrader.com
Gold COT chart (two year);
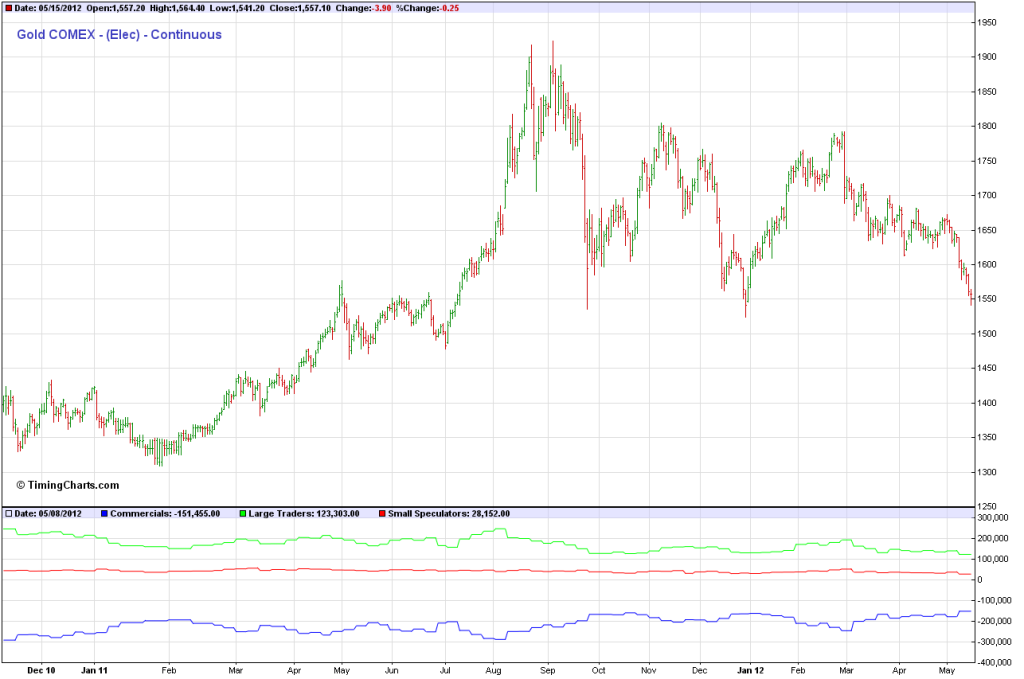
Chart from www.timingcharts.com
Commercials reducing short positions, large traders reducing longs.
-
Posted when silver was at $36.4
I think this may be the end of the cyclical bull market in silver.
...............................
...............................
...............................
...............................
Only time will tell.
I'm not talked about this view much, since it doesn't sit too easily in my mind and it's not that easy to reconcile with my position that Gold remains in a bull market (although arguably that may be about to be tested).
However, we have seen numerous examples over the last year of just how easy it is for silver to get cut down. Compared to other metals priced by ounce it is very cheap and there are regularly large amounts of silver derivatives traded (futures, options, ETFs etc), although the market is much smaller than gold.
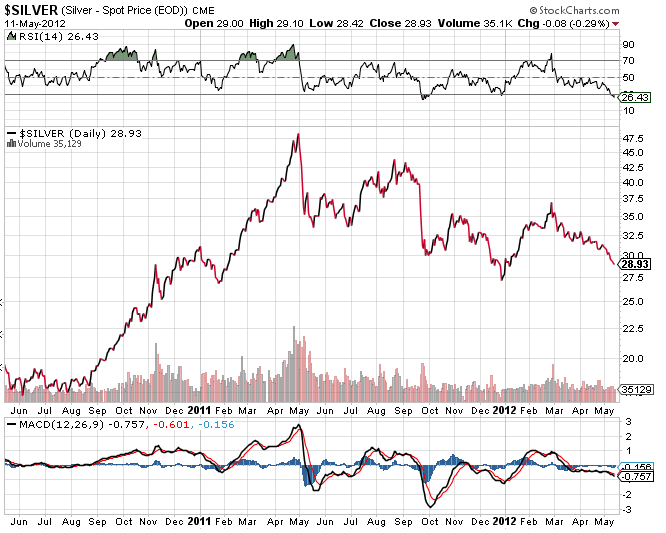
So yes it is a relatively cheap relative of gold and that makes it attractive and the silver market is relatively small, however although the size of the silver market is an attractive reason to believe that investing in silver longer term could be a sound investment the paradox here may be that this makes it silver's biggest weakness, it's easily manipulated. This may prevent the very substantial potential gains of the type you often hear trumpeted by those who don't have a deep knowledge of markets (and certainly I'm no expert). It's plain to see what has happened to the silver price when large numbers of sell orders hit the market, it has been summarily crushed on several occasions, whereas with gold although it has also taken a hit, the underlying strength is clear from the longer term charts.
Pull up a silver chart and it looks like a Samurai warrior has been using it for target practice;

-
I was considering as a last hurrah, now that I have no cash left, to do a gold to silver swap. However, both seem to be going down in tandem and so there is no point. Anything over 60 to 1 is well worth throwing in my last ounce of gold for silver.
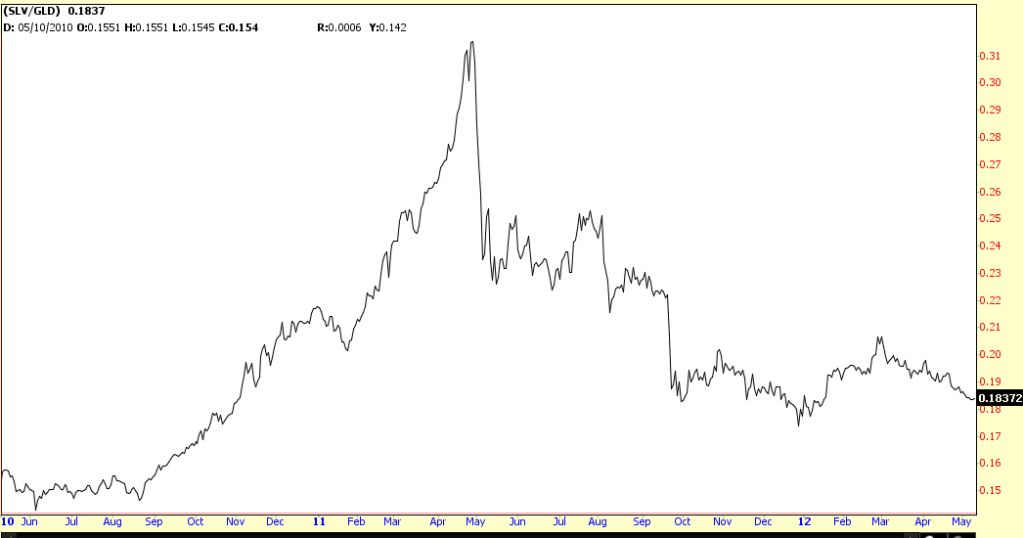
Based on the SLV : GLD ratio the trajectory is down, so whilst they're both going down, silver is going down faster than gold. Since the silver top in April 2011 Gold has outperformed Silver.
SLV/GLD 2 year
The correlation between SLV and FXE (The Euro ETF), with GLD also shown;
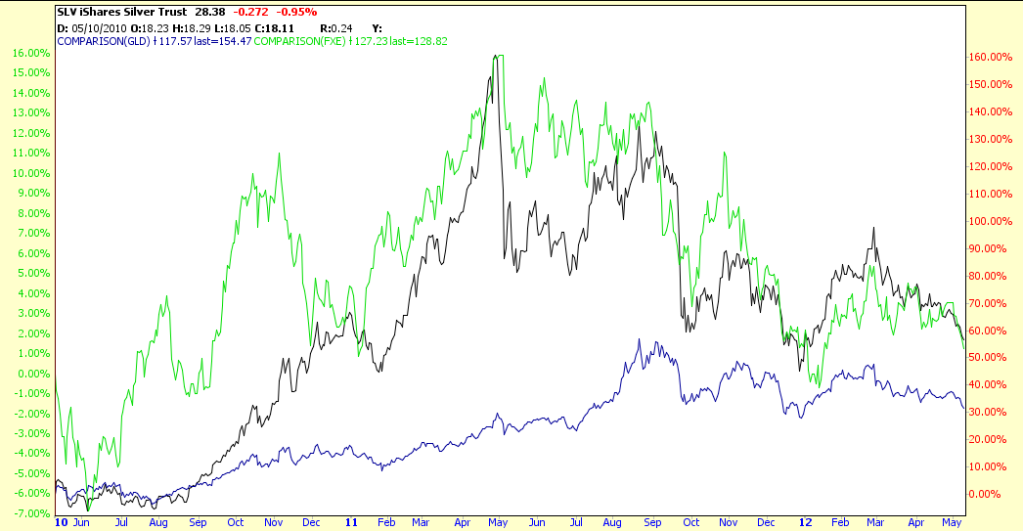
The Euro is very strongly correlated to Silver at the moment, what are your thoughts on the Euro Peppa?
-
Might be more printing on the way ??

"Roger that, clear for take off" - Tsshhsst
-
Pedro Schwartz talks to Alasdair Macleod about Italy, Spain and the European debt crisis
Halight you can embed youtube videos...
Eg
URL http://www.youtube.com/watch?v=EKLB8KhtRg8
You would type youtube URLHERE /youtube
to see this;
but you need to use square brackets round the youtube and the /youtube eg [ ]
-
Oh my god, it has already happened. The latent robotic gold monster has awoken and is now summoning all the hidden ounces of gold under Mount Fuji. It is certain that there will be an eruption in the next TWO WEEKS! I have been WARNING people about this for MINUTES!
I think you've exhausted any humour that was left in that mate.
-
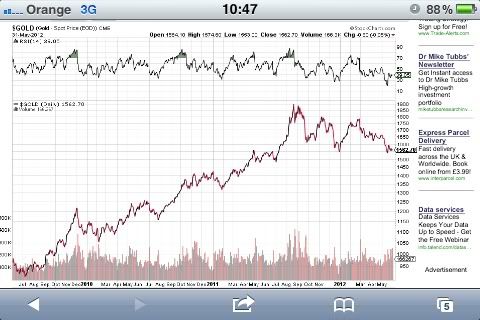
Based on this 3 year log chart of gold it would not be unrealistic to be looking for $2000 by September...
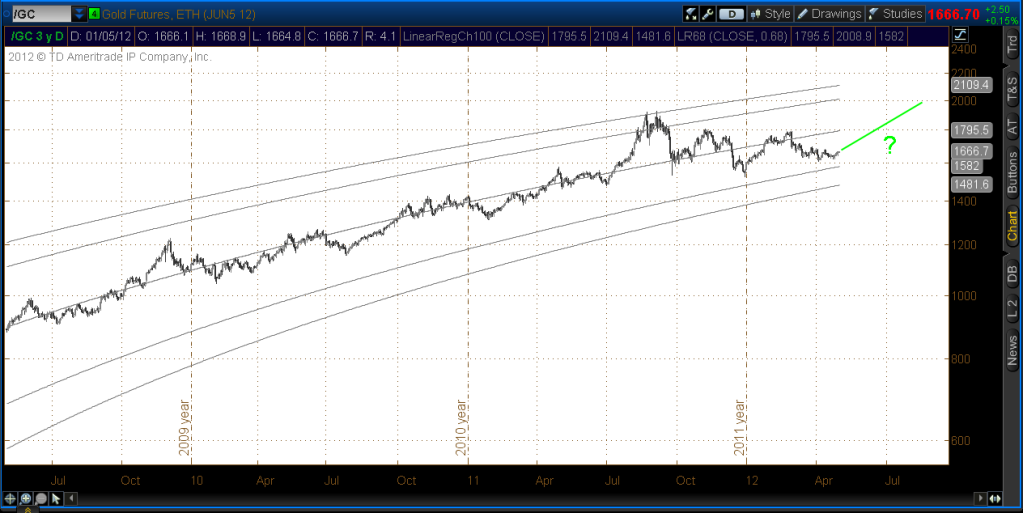
The linear regression trendlines allow you to see some context and within the context of the last three years the correction relative to the mean has been deeper.
Of course there's no guarantee the corrective phase is over. Maybe a sign of that would be a rally in gold miners...?
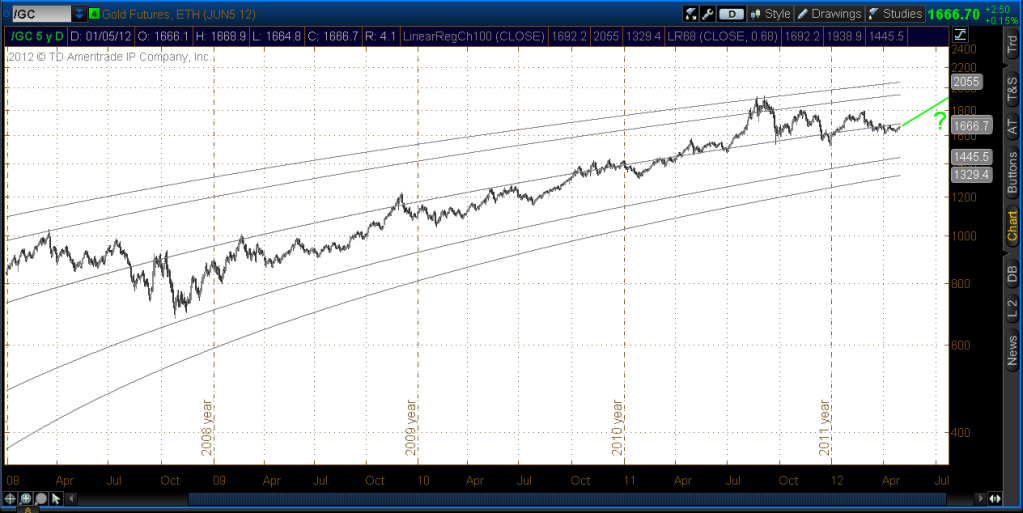
Looking back further we can see it relative to the 2008 correction;
-
It took me twelve minutes to write this, and I have solved all of world history. Spread the truth people. The TRUTH will ALWAYS win out.
All you need to do now is start a blog, charge for membership and bingo, you're in business.
-
PD,
What would that mean in the real world that the Euro is becoming more closely correlated to silver ?
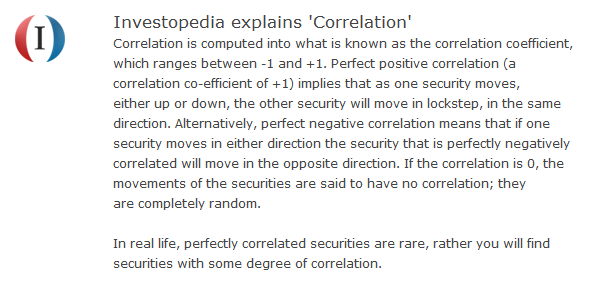
from www.investopedia.com


SILVER
in Gold, FX, Stocks / Diaries & Blogs
Posted
Not heard from David Morgan for a while...
Need to forward to 40 secs in