


notanewmember
-
Posts
2,639 -
Joined
-
Last visited
Content Type
Profiles
Forums
Events
Posts posted by notanewmember
-
-
The low oil price and rising gold (breaking above the $1300 area now), makes gold stocks on the radar again.
$1400 gold would be a 3 year new high, and that would be quite bullish.
The North Korean missile launch over Japan appears to be the catalyst on this move. I can't see how North Korea are going to back down, and this situation will reach a crescendo at some point.
-
Doesn't look good at $1316. Have scaled out of some positions to lock in the small amounts of profits. Will be entirely out of the trading positions if it is $1280 or less.
Gold will have to clear the next major round number of $1400 to get me interested.
-
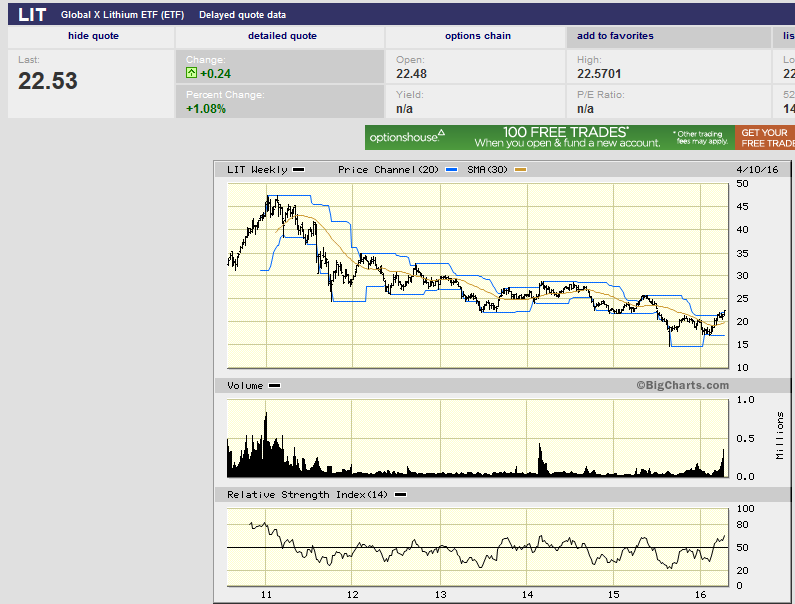
Interesting chart - now where have they really put their money? There's a lithium ETF "LIT", but I generally don't like ETFs.
-
BP. Down 9% today on awful results. BUT they are maintaining the dividend.
Sharephrophets are dipping a toe into BP.
-
We are seeing £1/Litre for 4 star petrol. If there was an easy way to buy petrol without the issue of contango, I would probably be investing in this for the long term.
I buy and use it each week.
-
Top chart - 5 year USD dollar / Saudi SAR exchange rate
Bottom Chart - Crude Oil ETF
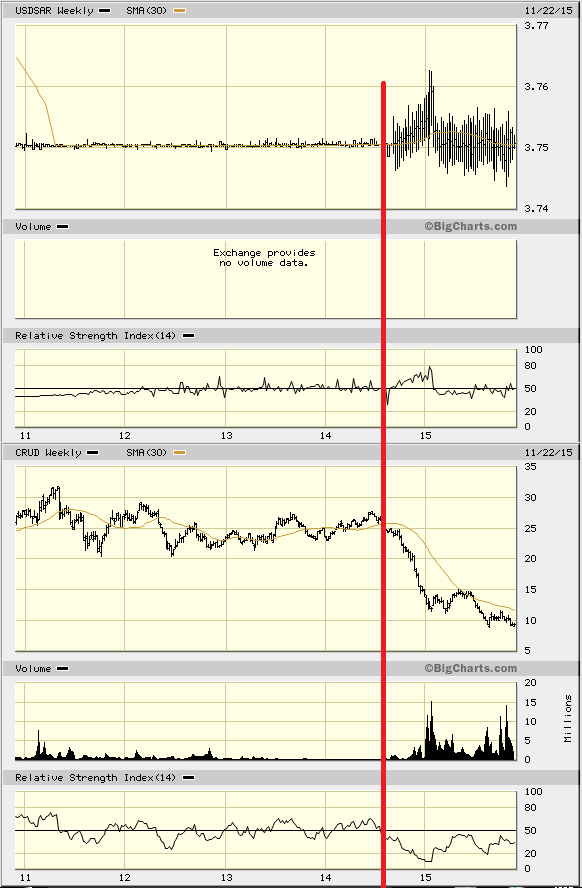
You can see the birth pangs of trouble appearing after the red line, that I've drawn, once Crude fell down in the 3rd quarter of 2014 (at around $90 a barrel the ETF uses a different value), Saudi currency reserves might have been used to keep that dollar/SAR peg. That is why we might be seeing that volatility in recent years. Hold onto your gold bars - as Rothschild once said in 2008.
-
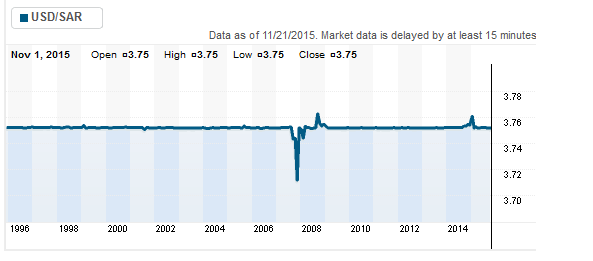
It might be worth keeping an eye on the Saudi SAR vs the Dollar
-
I don't think this has been posted, and there are no duplicate sources of the source of this, only paraphrases:
The 'Big Long' - Goldman Sachs And HSBC Buy 7.1 Tons Of Physical Gold
Aug. 10, 2015 3:40 AM ETSummary- On August 6, 2015, Goldman Sachs, which has issued very bearish forecasts on long-term gold prices, took delivery of a 3.2-ton purchase of physical gold.
- On August 6, 2015, HSBC which also claims to be bearish, took delivery of a 3.9-ton purchase of physical gold.
- In both cases, the purchases are registered as being for the benefit of the bank's own house account, rather than the accounts of customers.
- Investors should do as the banks do, not as they say.
-
^ and Facebook is his next largest holding, and he has recently added. I can't find any statement as to why he is buying gold, and more Facebook? It seems a odd combo.
-
Oil : Too much optimism?
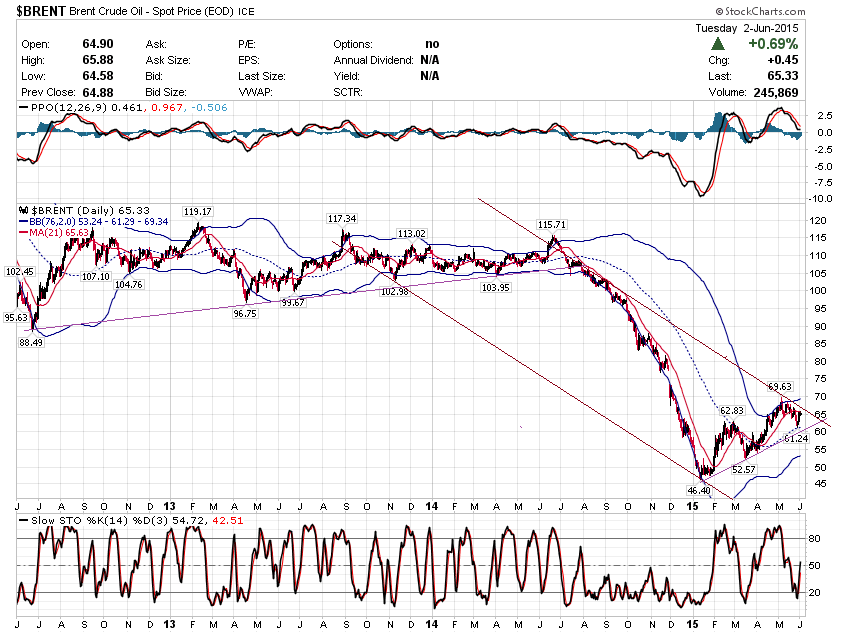
Oil producers hoping OPEC will cut output Friday to boost sagging prices are likely to be disappointed: The cartel's Gulf powers aren't about to surrender.
Saudi Arabia, Kuwait, the United Arab Emirates and Qatar are leading a fierce battle to protect OPEC's global market share by forcing others, like U.S. shale producers and Russia's state energy giants, to live with lower prices.
Years of $100 a barrel oil allowed the four exporters to amass reserves of $2.4 trillion, according to the Sovereign Wealth Fund Institute, a huge war chest for countries with a combined population of fewer than 50 million people.
They also used the windfall revenues to invest in infrastructure that gives them new weapons in the oil market fight.
. . .
Saudi Arabia's veteran oil minister Ali al-Naimi led the charge at the OPEC meeting back in November to keep pumping in the face of falling prices. That decision accelerated the price collapse, as it became clear the Saudis were playing a long game.
"We're not going to cut production, certainly Saudi Arabia is not going to cut," Ali al-Naimi told CNN in December. Asked if that position would hold for the first half of 2015, he bluntly stated, "No, it's the position that will hold forever."
Related: Smart money is buying energy stocks
Forever is a long time, but after discovering oil nearly eight decades ago, many believe Saudi Arabia is out to protect its legacy.
> http://money.cnn.com/2015/06/03/investing/opec-gulf-producers/index.html
That would be crushing news for smaller oil producers. But like the BOE and other talking heads, don't listen to what they say but what they do. When money and power is involved, inside knowledge is the key. We are all outsiders, and can only follow the trend after the price action. Do I believe Ali al-Naimi 100%? No. Their position can change, once their objectives are met.
Anyone proficient at shorting might be looking at frackers/shalers with no positive cashflow. That could be where the Sauds are hedging their losses in oil production. Net, net, they are either breaking even or still making tons of money. That is the beauty of market monopoly.
-
All quiet on the western front.
I can't see any buy signals yet. A two year new high would be just over $1400. I can't change my signature, but stick waiting has been the right thing to do.
-
Yes, I am very skeptical of all the hullabaloo about the gold apple watches. The math doesn't add up. Either there's not going to be much gold, or you have to be convinced that $10k watches that will be obsolete in 2-3 years will sell like hotcakes. Speaking of King World News, are they still doing their podcasts? The RSS feed went dead. I see at least they've revamped the website.
Yes, however they have made the site an Ipad/Windows 8 abomination!
I don't follow the podcasts, but they are still releasing them http://kingworldnews.com/broadcast/ You have to click into the links to see the dates of when they were recorded.
-
Ukraine Central Bank Conned Into Swapping Its Gold For Lead Bricks
http://www.zerohedge.com/news/2014-12-22/ukraine-central-bank-conned-swapping-its-gold-lead-bricks
$300,000 in gold missing from Ukraine Central Bank after swapped for lead bricks -
Well, gold is looking better if you live in Russia (the Rouble has been dropping like a stone)

-
Just bumping this excellent post again.
Just bumping this excellent post again.
Walktothewater, on 02 Nov 2013 - 9:17 PM, said:

I am saying that if the TPTB manage to actually properly destroy this bull market -- as would be indicated by sustained lower prices like $11 for silver (as suggested not by me but the OP) -- then I'm suggesting we enter a full on alice-in-wonderland of financial repression. As in a full on police state of capital controls with every price rigged and zero free markets. It s a frightening prospect akin to entering some sort of Dark Ages, but it cant be ruled out IMO
Right, the TPTB didn't get to where they are now and hold that position for 100 years by being easy to take over. This isn't a movie or a fairy tale.
-

GDXJ Gold Juniors ETF. Something is brewing with the volume. No buy signal on my "algorithm" but it is looking interesting.
-
Gold documentary - there are some familiar faces in there. Andrew Maguire, John Embery, etc.
-
The £20 silver coins are now all sold. BUT they will be striking another limited set with a new design
-
Note: I am not a tax advisor. This is how I think it works;
I guess you are exchanging £20 legal tender for £20 legal tender and thus no VAT is applicable, and the silver is FREE. FREE SILVER!!! I don't get charged VAT when I exchange a £50 note for smaller units at the bank equal to £50.
When I placed my order no VAT was added at the end. If you buy 3 coins (Above £50 P&P is free), the final price is £60. But will people accept the coin as legal tender? Well I had planned this to be my emergency money, I could either sell the coins OR exchange them to more regular currency at the bank.
The Britannia is a £2 face value coin, so I guess it is the other way around - you are paying for the silver, and the £2 denomination is ignored (when really it should be taken off the final price for VAT calculations).
-
Anyone in the UK might be interested in buying the new £20 half ounce coins.

http://www.royalmint.com/shop/UK_2013_20_pound_for_20_pound_Fine_Silver_Coin_George_and_the_Dragon
They are legal tender, contain fine silver.... they are VAT free.... and presumably like the Gold Sovereigns, are CGT free. Perhaps when Silver gets to £100 an ounce, these half ounce coins will be worth £50 intrinsic value!
If you buy over £50 worth, postage is free, so you exchange £20 for £20!
-
"My special report The 10-Bagger List for 2014 - containing the 9 gold stocks Louis thinks are most likely to become 10-baggers this year"
I don't think any gold stock will 10 bag this year. I am not bullish myself on gold stocks until gold gives us the right signals. Gold looks better over the last two weeks, but that doesn't make a new super bull market - yet. I have a few UK gold stocks on the monitor ( this thread is a good UK listed list;
http://uk.advfn.com/cmn/fbb/thread.php3?id=21909943
(advfn registration is free)
Gold is the dog that wags the tail (gold stocks), not the other way around.
-----------
EPIC ... £m ... Moz . Costs . $/Roz .... g/t ... Prod? ... $/t .. MC/Res . Margin
AAU ... 6.0 .. 0.81 ..... - .... 12 ... 1.52 .... CY14 .... 65 ..... 16% ...... 0
AAZ .. 22.3 .. 0.93 .. 1227 .... 39 ... 0.78 .. 57,316 .... 33 ..... 19% .... 21%
ABG . 1153.2 . 30.11 .. 1171 ... 62 ... 2.70 . 661,496 ... 115 ..... 30% .... 21%
AFCR . 10.8 .. 4.30 ..... - ..... 4 ... 2.00 ....... - .... 85 ...... 5% ...... 0
AGQ .. 17.4 .. 1.93 ..... - .... 15 ... 2.43 ...... 64 ... 104 ..... 23% ...... 0
AMA .. 32.4 .. 9.92 .. 1566 ..... 5 ... 1.40 .. 37,924 .... 59 ...... 7% .... -3%
AUE .. 72.9 .. 2.14 ..... - .... 55 ... 3.50 .... CY15 ... 149 ..... 58% ...... 0
AUR ... 2.1 .. 0.00 ..... - ..... 0 ... 0.00 ....... - ..... 0 ....... - ...... 0
AVM .. 24.6 .. 7.50 .. 1533 ..... 5 ... 1.35 . 121,924 .... 58 ...... 5% ... -13%
BGL ... 9.2 .. 3.51 ..... - ..... 4 ... 1.00 .... CY15 .... 43 ...... 4% ...... 0
BMZ ... 4.0 .. 0.33 ..... - .... 19 ... 8.50 .... CY13 ... 362 ...... 7% ...... 0
CEY . 605.8 .. 7.70 ... 647 ... 128 ... 1.11 . 366,184 .... 47 ..... 69% .... 55%
CGH .. 27.6 .. 5.56 ..... - ..... 8 ... 4.09 .... CY15 ... 174 ...... 9% ...... 0
CGNR .. 5.4 .. 0.60 ..... - .... 15 ... 1.60 .... CY16 .... 68 ..... 18% ...... 0
CMCL . 22.9 .. 0.46 .. 1279 .... 81 ... 3.88 .. 41,888 ... 165 ..... 50% .... 14%
CNG . 113.0 .. 5.01 ..... - .... 36 ... 2.66 .... CY15 ... 162 ..... 29% ...... 0
CNR .. 36.2 .. 2.37 ..... - .... 25 ... 3.50 .... CY16 ... 149 ..... 28% ...... 0
CRND .. 7.2 .. 2.76 .. 2238 ..... 4 ... 3.05 .. 10,812 ... 130 ...... 3% ... -49%
EUA ... 4.3 .. 0.00 ..... - ..... 0 ... 0.00 ....... N ..... 0 ....... - ...... 0
FRES . 7096 . 60.44 .. 1149 ... 190 ... 0.78 . 1180000 .... 33 .... 173% .... 22%
GAL ... 4.2 .. 0.33 .. 2296 .... 21 ... 7.00 ... 2,000 ... 298 ..... 31% ... -53%
GBGR . 49.8 .. 1.94 .. 1311 .... 42 ... 5.34 .. 30,356 ... 228 ..... 58% .... 14%
GDP ... 8.4 .. 0.93 .. 1564 .... 15 ... 2.39 .. 35,836 ... 102 ..... 19% ..... 3%
GGP ... 3.0 .. 0.09 ..... - .... 54 ... 0.00 ....... - ..... 0 .... 169% ...... 0
GRL ... 4.0 .. 0.29 ..... - .... 22 ... 1.77 ....... - .... 75 ..... 17% ...... 0
HGM . 223.6 . 11.11 ... 851 .... 33 ... 3.60 . 216,885 ... 153 ..... 21% .... 43%
HOC . 734.2 . 18.56 .. 1388 .... 64 ... 3.70 . 360,000 ... 158 ..... 42% ..... 6%
HUM .. 27.7 .. 3.82 ..... - .... 12 ... 1.28 .... CY16 .... 55 ..... 16% ...... 0
KEFI . 16.8 .. 1.50 ..... - .... 18 ... 2.34 ....... - ... 100 ..... 19% ...... 0
KGI . 154.3 .. 4.48 .. 1182 .... 56 .. 16.55 .. 91,518 ... 705 ..... 32% .... 17%
KGLD .. 4.5 .. 0.20 ..... - .... 38 ... 1.84 ....... - .... 78 ..... 30% ...... 0
KIBO .. 5.8 .. 0.80 ..... - .... 12 ... 1.20 ....... - .... 51 ..... 29% ...... 0
KLG ... 1.4 .. 0.00 ..... - ..... 0 ... 0.00 ....... N ..... 0 ....... - ...... 0
MARL . 14.5 .. 0.52 ..... - .... 45 ... 1.10 ....... - .... 47 ..... 31% ...... 0
MIRL . 22.9 .. 3.09 .. 1557 .... 12 ... 2.16 .. 23,392 .... 92 ..... 12% .... -7%
MML . 222.2 .. 3.35 ... 405 ... 107 ... 9.95 .. 75,000 ... 424 .... 121% .... 69%
MTL .. 72.2 .. 1.39 ..... - .... 84 ... 1.69 .... CY14 .... 72 ..... 46% ...... 0
MWA .. 18.2 .. 4.07 .. 1592 ..... 7 ... 2.48 .. 70,144 ... 106 ..... 8% ..... 4%
NGL .. 28.0 .. 3.44 ..... - .... 13 ... 4.70 ....... N ... 200 ..... 14% ...... 0
NMG ... 5.8 .. 0.00 ..... - ..... 0 ... 0.00 ....... - ..... 0 ....... - ...... 0
NYO ... 3.6 .. 0.47 ..... - .... 12 ... 2.34 .... CY15 ... 100 ..... 12% ...... 0
OMI .. 12.5 .. 0.78 ... 935 .... 26 ... 2.99 .. 67,404 ... 127 ..... 14% .... 29%
ORE ... 5.6 .. 0.00 ..... - ..... 0 ... 0.00 ....... - ..... 0 ....... - ...... 0
OTC ... 5.6 .. 1.33 ..... - ..... 7 ... 1.75 ....... - .... 75 ...... 5% ...... 0
OVG ... 6.9 .. 0.00 ..... - ..... 0 ... 0.00 ....... N ..... 0 ....... - ...... 0
OXS .. 10.8 .. 3.67 ..... - ..... 5 ... 3.23 ....... - ... 138 ...... 4% ...... 0
PAF . 259.8 .. 4.50 .. 1102 .... 94 ... 7.50 . 205,892 ... 320 ..... 89% .... 35%
PGD .. 84.5 .. 1.66 ..... - .... 83 ... 2.77 .. 21,652 ... 118 ..... 66% ...... 0
PGL ... 5.0 .. 0.34 ... 909 .... 24 ... 1.39 .. 19,028 .... 59 ..... 21% .... 47%
PML ... 7.7 .. 0.00 ..... - ..... 0 ... 0.00 ....... - ..... 0 ....... - ...... 0
POG . 179.9 . 25.06 .. 1301 .... 12 ... 1.12 . 632,000 .... 48 ..... 10% .... 18%
POLY . 2532 . 13.91 .. 1222 ... 295 ... 2.20 . 1124000 .... 94 ..... 82% .... 14%
RRS .. 4488 . 27.76 .. 1029 ... 262 ... 3.84 . 934,708 ... 164 .... 192% .... 28%
SAV .. 14.4 .. 0.00 ..... - ..... 0 ... 0.00 ....... - ..... 0 ....... - ...... 0
SGZ ... 2.2 .. 0.18 ..... - .... 20 .. 13.10 .... CY14 ... 558 ..... 19% ...... 0
SHG .. 71.0 .. 1.70 ... 972 .... 68 ... 5.30 .. 75,656 ... 226 ..... 45% .... 36%
SMA ... 4.7 .. 0.37 ..... - .... 21 ... 1.20 ....... - .... 51 ..... 65% ...... 0
SOLG . 74.7 .. 0.46 ..... - ... 261 ... 1.00 ....... - .... 43 .... 324% ...... 0
SRB .. 19.0 .. 0.67 ..... - .... 46 ... 6.34 .... CY14 ... 270 ..... 59% ...... 0
STG ... 3.7 .. 0.00 ..... - ..... 0 ... 0.00 ....... - ..... 0 ....... - ...... 0
STI .. 16.9 .. 0.87 ..... - .... 32 ... 1.50 ....... - .... 64 ..... 42% ...... 0
TGL ... 1.3 .. 0.00 ..... - ..... 0 ... 0.00 ....... - ..... 0 ....... - ...... 0
TPJ ... 1.5 .. 0.00 ..... - ..... 0 ... 0.00 ....... - ..... 0 ....... - ...... 0
TSG .. 12.9 .. 1.14 .. 1013 .... 18 .. 12.58 .. 27,332 ... 808 ..... 14% .... 33%
VGM .. 24.6 .. 4.20 .. 1585 .... 9 ... 6.16 .. 36,020 ... 262 ...... 6% ..... 0%
Avg ... 288 .. 4.54 .. 1270 .... 41 ... 2.94 ....... . ... 130 ..... 43% ..... 6%
£m ~ Market Cap at latest update
Moz ~ Tot attrib JORC/NI43 resource (may incl AuEq oz for polymetallic deposits)
Costs ~ Latest actual all-in costs of production
$/Res oz ~ value per attrib resource oz in US$.
g/t ~ Grade in Troy grammes per tonne Au (or AuEq)
Prod ~ 4x last quarter's production - or the estimated start year
$/t ~ calculation of in-ground value for gold + other metal credits per tonne ore
MC/Res ~ market cap as a % of resource value
Margin ~ % operational gold margin on sales -
$1350.
Gold looking strong as Russia flexes its might in the Ukraine.
-
Looking more bullish!
-
I about to get a buy signal on the UK house builders -it sounds mad, but there it is....
Builders Thread; http://www.greenenergyinvestors.com/index.php?showtopic=17414&page=4&do=findComment&comment=288989

Gold, PHM/Builders and the 4-6 months Cycle
in Gold, FX, Stocks / Diaries & Blogs
Posted
Hmm if gold clears $1400, then that's a 2 year new high. North Korea's H-bomb detonation today could be the catalyst. This could be the end of the stock bull run, and a resumption of the dow/gold run to 1-1 ratio.