-
Posts
5,790 -
Joined
-
Last visited
Content Type
Profiles
Forums
Events
Posts posted by Steve Netwriter
-
-
How is this for a suggestion; why not state the percentage of your worth that is in bullion [allocated and unallocated, I'm with Jeff Christian on this]
Seriously?

-
Here is a recreation, from my own datasets, of the most convincing gold graph I have seen. I think the original was a post from Steve Netwriter a couple of years ago, and it impressed me so much I have wanted to rework the data.
Nice

I think I got it from Adrian of Bullion Vault, just to give credit where it's due

-
What's his timeframe?
If he doesn't have one, it can never be disproved
I'm not sure about timeframe.
What I meant about disproved, is that so far no one has found fault with his theory.
Note he is talking about GoldUS$ in today's US$. One can probably assume he expects a timescale of less than 15 years, but that is just my point of view.
I repeat my oft-repeated forecast: Gold will be below $1100 in August.Wait until then to buy=
Have you changed your mind?
Since it's broken the downtrend from June.
-
Sorry, missed a bit:
I mean, it wouldn't make much sense to map the kiwi dollar against the UD dollar logarithmically right?Not for very long, no.
The NZ$US$ exhcange rate might move by x% per year for 10 years, and be an exponential move.
For those 10 years it would make sense to plot it on a log scale. Necessary if you draw straight line trend lines.
But, one would not expect that movement in exchange rate to continue forever. It would appear to be unlikely!
This is different to GoldUS$. The purchasing power of the US$ can decline by 7%/year with no limit, until it reaches zero

This is most important if GoldUS$ were to change by 30%/year, and over a very short period you would see a curve.
-
But I still have a question puzzling me; say gold continues to only modestly strengthen against the US dollar [just for arguments sake] at say 20% a year, would it matter that much whether the chart was a logarithmic or a linear scale? I gather logarithmic charts are best for the large exponential moves.
Or in other words, say all currencies stay relatively strong against assets, but gold in turn strengthens against currencies... we would be looking at gold/ US dollar in terms of an fx exchange.... and not as a "mop for excess liquidity".
I mean, it wouldn't make much sense to map the kiwi dollar against the UD dollar logarithmically right?
This is why Albert Bartlett says "The greatest shortcoming of the human race is our inability to understand the exponential function".
I'll explain it very simply, as you can learn more elsewhere.
1. If a number (whatever it is, it could be a weight, and length, a price, an exchange rate) increases by a fixed percentage each period (say each year), then it will follow an exponential function.
y = e ^ kt
2. If you plot that curve from time t0 to time t1, they being the starting and ending times, and you plot on a linear vertical scale from ymin to ymax, then the plot will be curved, an exponential.
3. What matters most are the period over which the curve is plotted and the rate of change. The higher the rate of change, the steeper the plotted curve will be.
4. Yes, if the rate of change is smal, and you plot over a few years, the line will be close to straight. But if you increase the rate of change, or extend the period of the plot, it will become more curved, and a linear plot with straight trend line drawn will be more erroneous.
For more, please see this:
Exponential Functions, Things that grow at x%, and Bounded and Unbounded Plotting of them by Steve Netwriter
http://neuralnetwriter.cylo42.com/node/2944
and this one which appears to have been inspired by you!
Exponenetial Function
http://neuralnetwriter.cylo42.com/node/2889
Both Albert and Sal explain it better (and for longer) than I can in a short post.
The first link shows that it appears to be difficult for people to grasp this. Go back to apples on trees and you can see more easily how it works.
As you'll see, Chris Martenson was quite correct in the way he plotted his exponential curves, and in the implications he took from them.
-

The volatilty of gold looks to be settling down compared to previous years. Does this signal a steady strengthening along the trend line? I'd be happy with that... given that currencies might also be strengthening against assets.
Link to last month's thread:
Logarithmic
 :D
:D 
-
The dollars might not be hyper-inflated, but the prediction sure is.

No it is not.
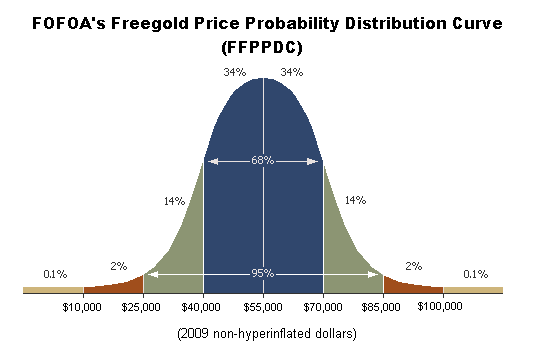
FOFOA's freegold theory is very convincing, and has yet to be disproved.
Other than cut/print/default how else can the US get out of its current predicament?
-
This is inline with my thinking at the moment.
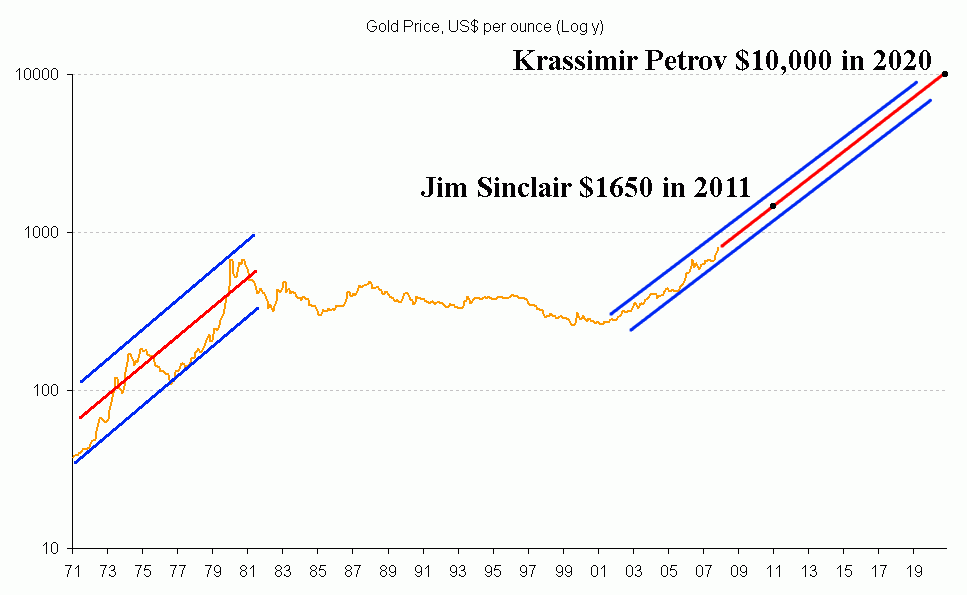
What's your timeline for your $1,650 prediction? JS's was on or before 14/01/11, but looking at your chart it looks like it will be later than this.
Hi warpig

First, interesting post about the aircraft! It's always good to hear real on the ground experiences.
The seasonal peaks seem to occur sometime between Jan and May. I think timing is the most difficult to predict, except in hindsight

I wouldn't mind betting Jim's prediction will be a few months too early. But, if something else breaks, who knows.
I only do this out of interest, for fun. My real view varies between this (note I did it a few years ago):

and this from FOFOA:

-
Hi guys, I've been so busy recently, very little time to even check in here

I have just done a quick update to my charts though, you may find it interesting.
My prediction in a line:
GoldUS$ maybe down to 1,100, then off to ... wait for it.... yes 1650 peak, before dropping back and consolidating.
Gold G5 Index Chart with extra information
http://neuralnetwriter.cylo42.com/node/3201
-
Nevermind the tits. Does anyone have a Nikkei/Gold chart? Approximity? GF?
Konnichiwa,
If the JP225 is acceptable, then go here:
http://www.dailyfx.com/charts/netdaniachart/
You have JP225 & some odd thing called XAUUSD

You can overlay or do them relative.
Use "Instrument" to get the first, then right click on the chart to add the 2nd.
Since 2000, JP225 is up, down, up, down, up, down.
XUA is.....up up up up

-
The Price of Apples
Thanks for your replies guys.
It's not a test, so I won't be marking your answers

You get a better quality of reply on here than I would expect in many other places. I think it's a gold thing

I did want to get you all thinking about stocks and flows though.
The "stock" answer would be calculated like this:
Stock = 100 apples. Money in existence = $500.
If all the money "flowed into" the stock of apples, that would be $500 spread over 100 apples, or 500/100 = $5 per apple.
That IMO is wrong

The Flow answer would be calculated like this:
There is nothing to eat or drink on the island, just apples. Only one fool is willing to sell his one apple for some dollars.
That's potentially $500 trying to buy 1 apple.
Maybe $500 per apple (on sale) is closer to the answer

Why am I making this point?
Of those who currently hold real physical allocated gold, how many are willing to sell?
So what is the real supply?
How much "money" might end up chasing that gold?
Yes, ultimately, the only oz of gold for sale might be chased by all the "money" in existence!!!!
So the maximum, theoretically, is quite high.
Yes, in practice, if only 1oz of gold was for sale people would buy other things, but it is the basic concept I wanted to highlight.
-
After hours and hours and hours of reading I am still alive and undergoing deep anti hypnosis therapy by seeming hypnosis of another kind.
 Suffice it to say the FOFOA strategy for our financial well being would be to simply keep on buying gold until we can no longer, correct?
It's like the long way round Jim Sinclair. I wonder if they are related?
BTW Steve, I am passively enjoying your site but it seems I have forgotton my password. That may be for the best, for on these topics I am feeling lost or losing it and what I post would make me feel like elementary school grade 2 or maybe 3. At the moment I am happy with ''teacher says buy'' so I buy.
 When you are done with the FOFOA for dummies, please forward me the link.
(I greatly enjoyed the Gecko/Denninger article).
You've gotta love Karl...bless him

You may wish to "request new password", as there is a new members only economic area, which may stretch your mind further

Or, you may wish to answer the question

I think FOFOA might put his strategy slightly differently, or at least I would.
Sell your financial assets, houses, stocks, currency - all of which are financial assets.
Return to money - gold.
Wait , and be prepared to be shocked.
I notice no one answered my simple question about the maximum possible 'price' of gold.
How about this one then.
You are on an island, there are 100 apples.
There is $500 in existence on the island.
What is the maximum price of an apple?
Answers please

-
Yes, probably the best one. I'm glad you like it. I'm sorry I appear not to have promoted it before

-
Is this the quietest bull in history?
I'm listening, but I can't hear anyone making any noise about this.
GoldUS$=1263.47
and SilverUS$=19.39, getting very close to "interesting" levels.
Oh wait, I hear it now, the distant thunder of currencies collapsing around me

================
Someone asked about Another/FOA/FOFOA recently.
I did look, and to my great surprise I couldn't find references to them in the notable threads list!
Sorry about that.
I've been posting about them for ages, I'm puzzled I haven't done that on here

http://neuralnetwriter.cylo42.com/forum/91
Here's FOFOA's latest:
http://neuralnetwriter.cylo42.com/node/3053
I VERY STRONGLY suggest everyone read the recent few articles of FOFOA.
I do believe many people have not quite the right idea about gold.
For example, please, can someone tell me, what is the maximum 'price' of gold?
Here are some numbers to work with, if that helps.
Total world wealth in 2007 in 2000 US$ = 125.25 Trillion [1]
Equivalent 2010 dollars = 125.25 TUS$ * 1.25 [2] = 156.56 TUS$
Total above ground gold = 158'000 metric tons [3]
-
Stocks up. Euro up.
RH, and others, you may be interested in the other NetDania facilities out there.
I use the NetDania site itself, and I think you use goldprice.org ?
I looked for others yesterday. Depending on your desires, you may find merit in the others.
Specially the DailyFX one

I've done some screenshots:
-
U.S. asset managers worried Obama could confiscate gold
LONDON -
Speaking at the FT Silver conference in London yesterday, lead-off speaker John Levin, HSBC Bank's Managing Director, Global Metals and Trading (HSBC is one of the world's top precious metals traders and its vaults in the U.S. and Europe hold huge holdings of gold and silver bullion) recounted conversations with some of the U.S.'s top asset managers controlling massive amounts of capital asking if HSBC had the capacity in its vaults to store major gold purchases. On being told that the bank's U.S. vaults had sufficient space available he was told that they did not want their gold stored in the U.S.A. but preferably in Europe because they feared that at some stage the U.S. Administration might follow the path set by Franklin D. Roosevelt in 1933 and confiscate all U.S. gold holdings as part of the country's strategy in dealing with the nation's economic problems.
I think FOFOA and Ender offer an interesting view:
http://fofoa.blogspot.com/2009/08/confisca...erent-view.html
I'm so impressed by the writings of FOFOA and 'predecessors', that I'm thinking of locking myself away and just reading and taking notes for all the writings.
Just worried I miss "the event".
-
Just to put it into perspective (steamrollers & nickels come to mind...)
Exactly

-
Tom O'Brien has been long Gold since $282 in 2001. His argument is quite simple: buy low, sell high. Given the recent parabolic price action in Euro Gold etc., he is arguing that now seems a good time to take money off the table? Anyway, he seems to be playing it by ear, and so far is only calling "a" top, not necessarily "the" top. But he is walking the walk, cashing in all his gold and going short! However, he is a trader, so I'm sure if the situation were to change, he wouldn't have too many hang ups in jumping back in.
IMO he's the sort of person who is likely to be wiped out.
And it seems to be a very very common paradigm these days. The "trader paradigm".
An extremely dangerous tactic in these times.
I wonder whether he will be happy with his "US$ profits"

-
Jake,
Confiscation was a question I had in my list that needed answering.
You prompted me to go find out.
http://neuralnetwriter.cylo42.com/node/2985
Cheers
-
Exactly.
Does FOFOA talk about this anywhere? eg. Nationaliation of mining companies. Confiscation. Outlawing trading in metals.etc..
Yes, but I'm not sure where!
I am interested in the gold/acres thread I think you had about 2 years ago...do you know where I can resurrect it?I think I wrote about land being the major contributor to house price rises.
I'm not sure it was me who did land in oz of gold. Maybe GF ?
-
Steve,
That suggests a FLAT correction to me:


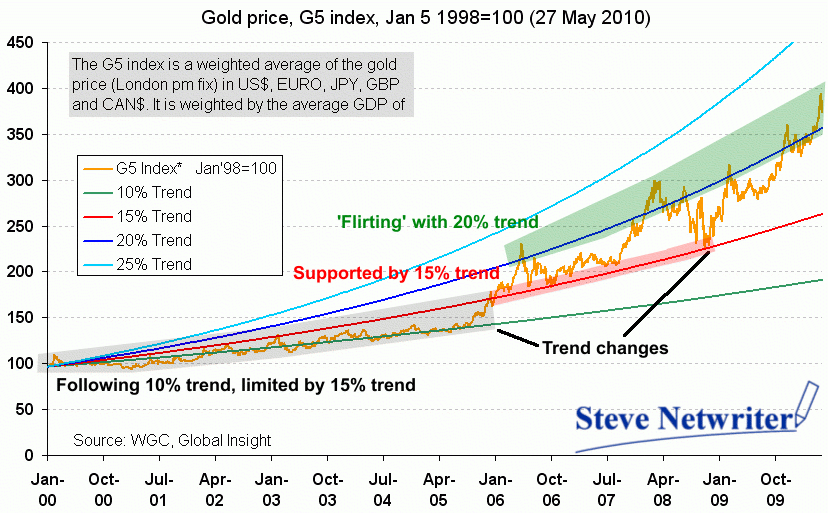
It's a little unclear to me at the moment.
I see a few possibilities:
1. A change of trend line from the old 15% red to 20% blue.
2. A change back to somewhere between 15 and 20%.
3. A retracement back to the 15% red line.
4. A completely new trend at 50%, which is what it's been on since it left the 15% trend line, which is quite a long time.
I'm a total convert to the G5 Index, IMO it paints a much clearer picture. I've ditched my old chart because of it.
From here:
Analysis of Gold Movements Using the New G5 Index (inspired by and for shuttle) by Steve Netwriter 27 May 2010
http://neuralnetwriter.cylo42.com/node/2920
-
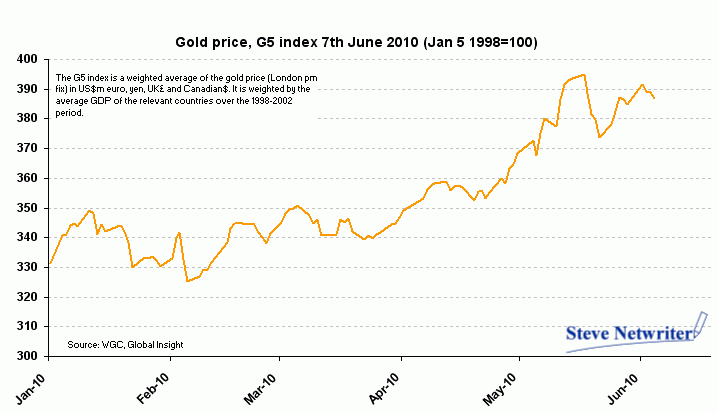
Look at gold versus more than just the US$ for this year:

-
May I ask what kind of world we will be living in under the scenario of Goldhouses/GoldOil?
If/when I work it out, I'll let you know

Predictions that vary from the current state by a large amount worry me. Not because I think they are wrong, but because I worry that the common man will be prevented from benefiting.
-
Can't take this guy seriously anymore. He doesn't even bother to look at inflation-adjusted asset prices and price ratios.
EDIT: Also, gold is the world shadow currency (momentarily in the shadow, I should add). Restricting it to a metals subforum just shows that he is as moronic as the guys over at HPC.
Quite.


GOLD
in Gold, FX, Stocks / Diaries & Blogs
Posted
Well, I think unallocated should concern you, unless it's just a small percentage for gambling, and you can afford to lose it.
"ETFs should not be owned by serious professional investors" - Ben Davies.
The difference is significant, and IMO with allocatd physical you are on the side of sanity and fairness, and unallocated and paper gold, you are siding with the central banks and lies, scams, and unsustainability.
You have to pick your side and be judged on it.
I wasn't aware there were any strong currencies, only those less weak than others.